$HIVE & $BTC Technical Analysis - 22.06.2025
Today's edition of my technical analysis is something I've been looking forward to as we're at a crucial level and it's good to make a plan for next week. I've been using this analysis to know which level to watch when swapping HBD to $HIVE and if you're interested in making some profit when swapping our two tokens, you should too.
$BTC has also made some progress in one direction, so let's see where these tokens are now and what we can expect.
As you know, this morning the US bombed Iran. I'm not going to comment the event, but it's important to make a note about it as it had some effect on the markets too. Whenever Geo-political events take place, people rush to get out of risk markets and secure their capital. This means crypto usually takes a hit. The extent of the hit is different each time, some assets are more sensible, others with strong fundamentals resist better.
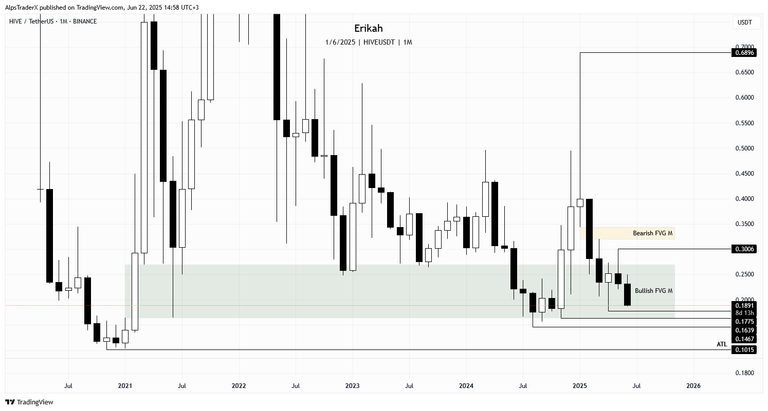
There's one whole week and a day till the monthly candle closes, so nothing is set in stone at this point, but for those of you who are not familiar with reading the charts, so far we have a bearish candle with a substantial body and price is closer to sweeping $0.1175 than ever. I've been mentioning this level in my previous posts and here we are, nearing towards it.
With the current Geo-political situation, I'd be cautious and would watch the next two levels marked on my chart, $0.1639 and $0.1467. There's no guarantee price is going to sweep those levels, but we have to know where and how to react if those levels are hit.
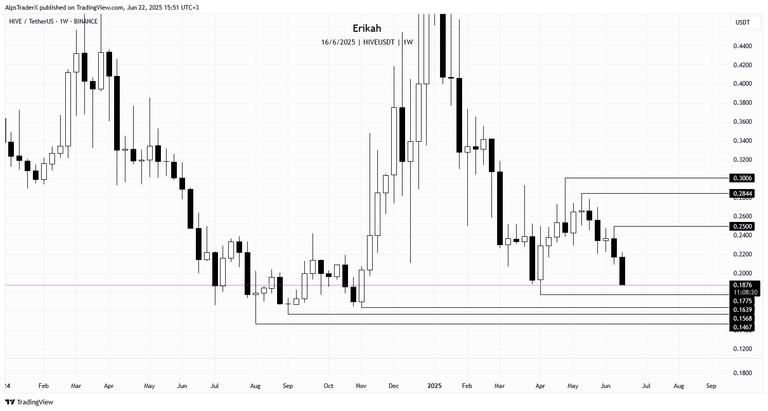
On the weekly time frame price also looks heavy and close to sweeping the swing low at $0.1775. If we don't get a bounce and a reversal at that level and there will be more weakness, the next levels on the downside I'd keep an eye on are $0.1639, $0.1568 and ultimately $0.1467. I don't want to mention all time low (ATL) at this point, which is at $0.1015. Let's not go there yet as the situation is not so dramatic.
The sell side of the curve (or the leg down) is pretty balanced, there's no not much to stop price.
In case of a bounce at any of the levels mentioned and some strength, the first swing high, that is not yet confirmed, is at $0.25. This level will be confirmed as swing high, once this current candle closes, which will happen in around 11 hours. Above $0.25, the next possible level I'd watch are $0.2844 and $0.3006.
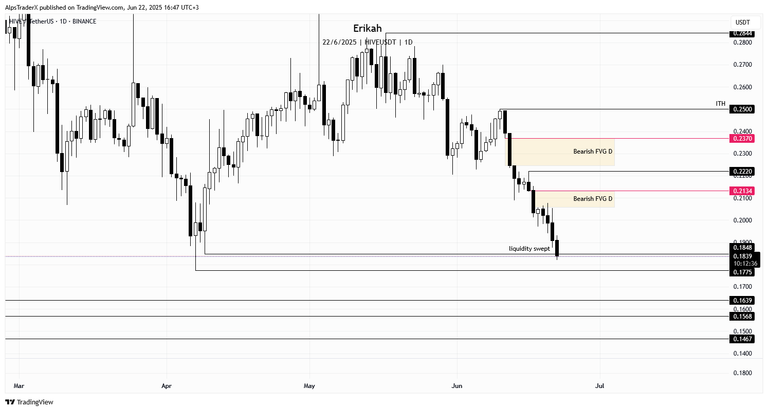
The daily chart shows price is heavy, has just swept liquidity flow below the swing low at $0.1848 and possibly heading towards $0.1775. Here the price action (PA) is not as balanced as on the weekly chart, the leg down, or the sell side has two major bearish gaps, that could reject price easily once it get s there, but let's take it step by step.
On the way down, you have the levels I'd be watching on the chart. Would be nice to see price bouncing after sweeping $0.1775, but as there's never guarantee for anything in this game, keep an eye on $0.1639, $0.1568 and ultimately $0.1467.
If we get a reversal at some point, for bullish continuation price needs to close above the bearish fair value gap (FVG) marked with yellow, and hold $0.2134. If these conditions are met, the nest swing high is at $0.222, after which comes the other bearish fair value gap (FVG), which price needs to invert and hold above $0.237, then $0.25 is next.
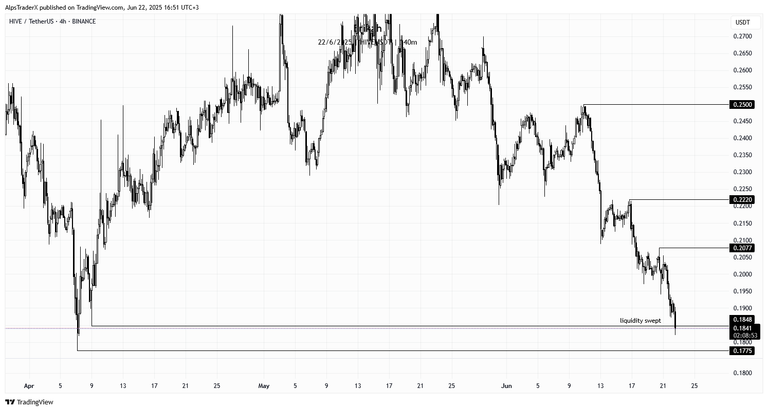
On a more granular scale, the h4 chart shows price at a very important level. Has just swept $0.1848, which was the next swing low on the left. You can see the $0.1775 level next, and I'd like to zoom in now, to show you what you can expect.

At the time of writing, there are another two hours till the current candle close and price is slightly below the swing low price has just swept. You know the levels in case of more weakness, so let's see what can we expect if we get a bounce here.
Yesterday's price action (PA) was a bit violent and price created two bearish gaps on the way down. These gaps mean internal liquidity and can reject price. I'd be cautious longing into them, but once price manages to invert them (close above them and hold), $0.2055 and $0.2077 are the next two liquidity pools. In case we see the necessary strength for price to sweep $0.2077 and hold, I'd be cautious the the nest bearish gap, which can also reject price.
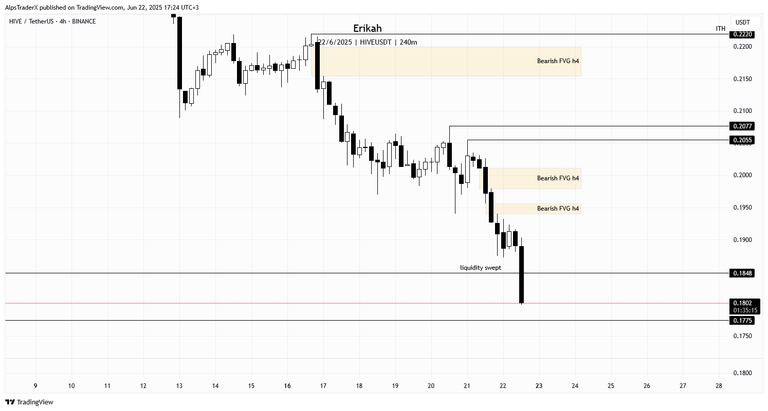
... and this happens while I'm trying to finish my post. Just a matter of time till $0.1775 is swept.
Ok, let's see what $BTC has been doing this week.
The bearish gap marked with yellow on the chart is capping the market at the moment and sweeping $102,626 is a question of WHEN, not IF, if you ask me. In case that happens, I'm expecting a bounce from that level, but if there's more weakness in the market, price can sweep $100,350 as well. source
This is what I wrote last week.
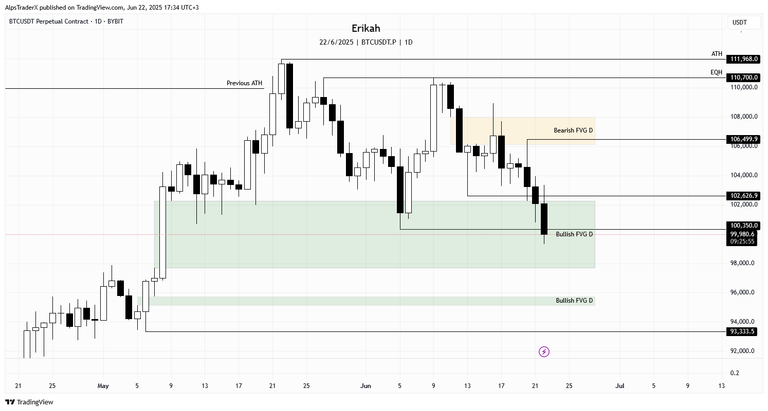
Here we are today. $102,626 swept. $100,350 swept. Price is inside the bullish gap that has been holding price since for the past 43 days. It has not been fully rebalanced yet either.
As long as this gap manages manages to do its job, which is to defend price, we can expect a bullish continuation to the upside. In case the daily candle closes below the gap, there's another bullish gap between $95,149 and $95,724, a slim one, but we can't dismiss it. If that gap is lost, then the swing low at $93,333 could be next.
I'm not going to lie, I don't like the current price action and the uncertainty we're going through complicates things further. Let's see what Monday brings.
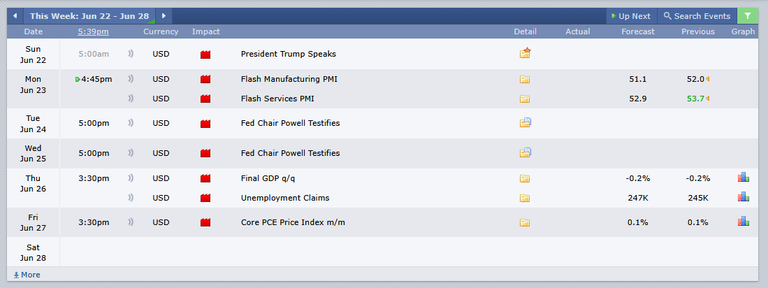
Next week's economic calendar is full, we have 5 red folder days, plus the Geo-political situation in hand, so if you're a newbie, I'd stay away from gambling with leverage. These are not times to gamble with your hard earned money.
Remember, technical analysis is not about forecasting price, but about reacting to what price does.
As always, this is a game of probabilities, not certainties. Also please note, this is not financial advice, it's my view and understanding of the market.
All charts posted here are screenshots from Tradinview.
Come trade with me on Bybit.

If you're a newbie, you may want to check out these guides:
- Communities Explained - Newbie Guide
- Cross Posting And Reposting Explained, Using PeakD
- Hive Is Not For Me
- How To Pump Your Reputation Fast - Newbie Guide
- Tips And Tricks & Useful Hive Tools For Newbies
- More Useful Tools On Hive - Newbie Guide
- Community List And Why It Is Important To Post In The Right Community
- Witnesses And Proposals Explained - Newbie Guide
- To Stake, Or Not To Stake - Newbie Guide
- Tags And Tagging - Newbie Guide
- Newbie Expectations And Reality
- About Dust Vote And Hive Reward Pool, by libertycrypto27

!discovery 30
!PIZZA
Thanks Jesus.
This post was shared and voted inside the discord by the curators team of discovery-it
Join our Community and follow our Curation Trail
Discovery-it is also a Witness, vote for us here
Delegate to us for passive income. Check our 80% fee-back Program
$PIZZA slices delivered:
@jlinaresp(5/15) tipped @erikah
Come get MOONed!
Ahora si creo que voy pa mis órdenes de los 0.17 y 0.15 👏👏, luego de ahí es crítico los demás niveles si baja más hive, tanto pa los inversores o la blockchain en general @erikah, buena es tu estrategia de mercado amiga.
Saludos y a cruzar dedos 🤞 mientras a descansar este domingo!!
@ibarra95 you know I don't speak Spanish. I've never posted anything in Spanish, I don't understand it and anything you post in Spanish I need to translate it. I don't want to sound disrespectful but if you understand what I post in English, I'm sure you can post your comment on English as well.
En BTC ya Mismo tengo una orden activa en futuros desde los 99500 pero no se si tenga rebote, esperare unas horas sino me salgo de la estrategia.
I didn't expect this from you, You gave a downvote on a post I worked very hard on.
That post took a lot of effort and time from me.
you please tell me what mistake I made in that post? 😓
Your one downvote destroyed all my hard work. 😢😭
I don't give a shit about what you did or didn't expect. This comment is spam, has nothing to do with my post.
Can you please tell me when you will stop downvoting my posts?
Congratulations @erikah! You have completed the following achievement on the Hive blockchain And have been rewarded with New badge(s)
Your next target is to reach 520000 upvotes.
You can view your badges on your board and compare yourself to others in the Ranking
If you no longer want to receive notifications, reply to this comment with the word
STOPkudos for that analysis, honestly i've never understood how to read those movements on crypto, i can on betting exchanges but no on this... so i never made predictions or plans, i've just recently to link geopolitics to price
i expect more US action on Iran, that tonight was a mere final warn, so from my point, we will probably go a bit more down
You're welcome. Reading the charts is not easy, it takes a lot of time to learn about price action and candles and not everyone can learn it.
I'm happy to post these weekly analysis because it helps me see where $HIVE is at the time of writing.
Let's see how the geo-political events evolve this week.
Thanks for pointing out the geopolitical factor, honestly, I tend to forget how world events can shake up the charts.
It must be taken into account as it moves the markets.
Ah, the timing of the price drops was very unfortunate for me. Somehow, countries choose important days for me and do absurd things on those days. Thank you for the excellent analysis; I hope the market changes direction soon. I am getting married soon and need this 😂
Well, I wish you all the best on the upcoming marriage. I would definitely not hold my breath on the matter. Even if we get a sharp reversal here with nice momentum, will not help you much. God knows when we're going to get to ATH again 😬
I'm not sure if we will ever see there again 😂 68 cent at January was very good. Even that would help me a lot!