A Look at the Second Largest Stablecoin Circle’s USDC | Data on Marketcap, Users, Chains Allocation and Comparation to Tether
USDC has been one of the stablecoins that has tried to grow and build a reputation as the safest and the most legit out there. It wants to be a legitimate competitor to Tether USDT, but US based and in compliance with all the regulations, unlike Tether that is an offshore company and not a subject to US regulations.
But even with all its regulation and compliance USDC had a real market test back in March 2023, when due to a bank failure it lost its peg during one weekend. Before this event, USDC was considered by most the safest stabelcoin to park your dollars.
Let’s take a look at the growth of USDC through some data.
USDC is issued by Circle. It is a US-based company that is regulated and has regular audits on its holdings.
Here we will be looking at:
- Daily USDC printed
- Monthly USDC printed
- USDC supply
- Number of daily users
- USDC chain allocation
- USDC VS USDT
The data is collected from tools like Coingecko and Dune analytics.
Daily USDC Printed
USDC started at the end of 2018, but here we have data from 2019, for simplicity, and because there is not much movement in 2018.
Here is the chart for the USDC printed per day.
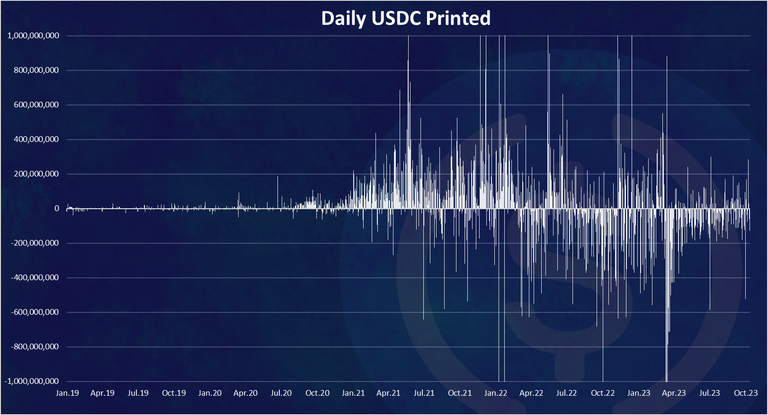
As we can see in the first years there was not a lot of printing for USDC. The larger amounts started to come in 2020 and increased significantly in 2021.
On times there were more than one billion USDC issued per day.
We can notice the burned USDC that is starting to dominate in the last period.
Monthly USDC Printed
Here is the monthly chart for better visibility.
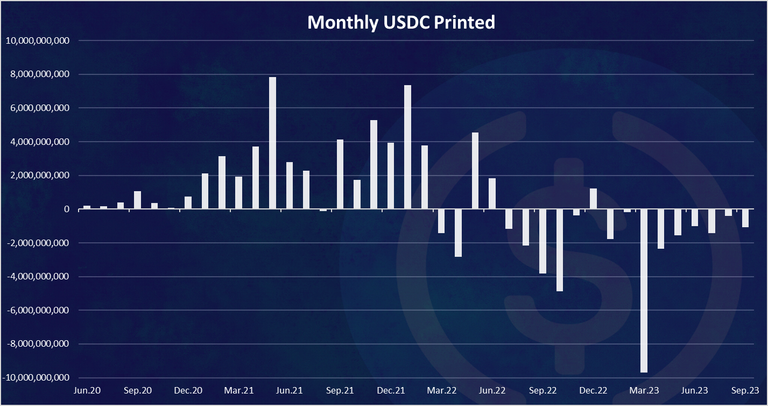
We can see the somewhere up to 2022, there was in general more USDC monthly printed, and then in 2022 the trend shifted with almost every month being in the negative.
A massive negative bar in March 2023, when almost 10B USDC was taken out of circulation. This was during the deppeging event.
We can see how harsh the market can be on these assets. Instant liquidity is needed for them to operate stable at all times. Long term lock ups are not an option here.
USDC Supply
The chart for the UST supply looks like this.
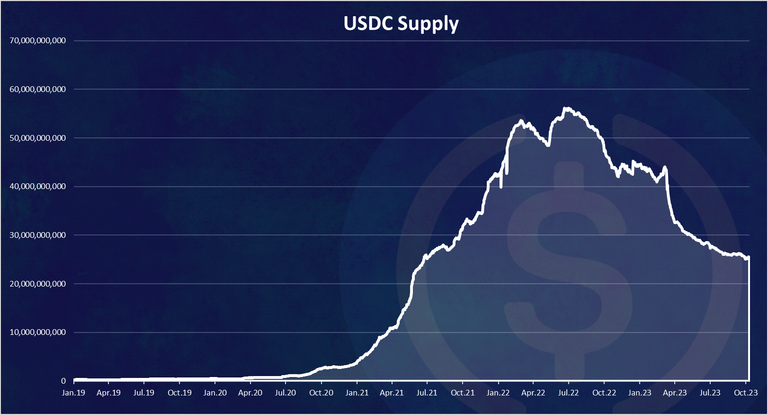
We can see that prior to 2020, the marketcap of USDC was negligible, with under 1B in supply. Then a huge increase in 2021 when there almost 40B USDC added to the supply.
The peak for the USDC market cap was in June 2022, with around 55B in market cap. At this time Tether was experiencing FUD, and a lot of the stablecoins were transferred to USDC.
Since the summer of 2022, the supply of USDC has almost constantly going down, with a massive drop in March 2023 and a slower downtrend since the.
If we zoom in we have this.
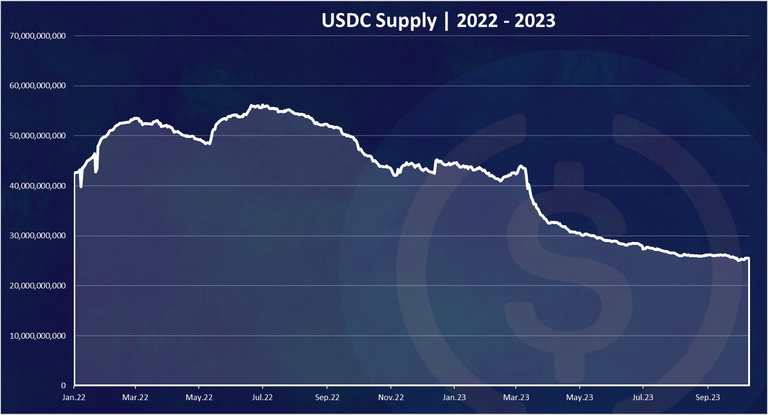
Here again we can see the overall downtrend for USDC in 2022 – 2023. At the moment the USDC supply is 25B.
Number of Daily Users
Here is the chart for the number of daily users making some on chain transactions with USDC.
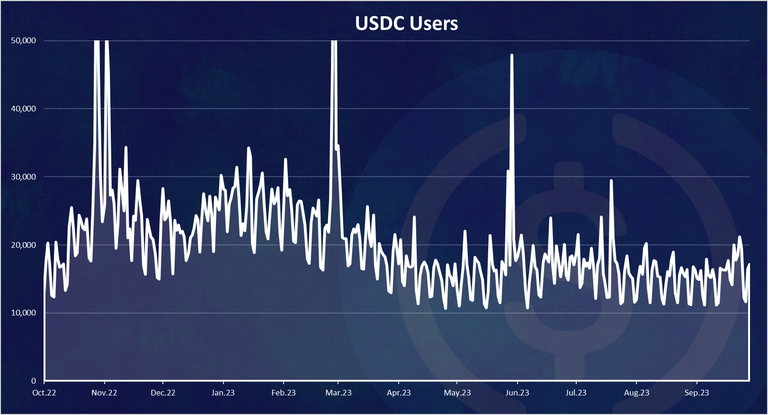
We can notice that in the last period the number of DAUs for USDC has been quite constant with around 16k DAUs on average.
USDC Allocation on Different Chains
USDC is centrally issued but can live on multiple chains. Here is the chart.

Obviously, the big share of USDC remains on Ethereum with 85% share. Next is Arbitrum, Polygon and Solana, all with less than a 5% share. For example Tether USDT has a dominant allocation of the tokens on the Tron network and then Ethereum.
USDC VS USDT
How is USDC doing against the number one stablecoin Tether? Tether was funded three years before USDC, so it has some head start. Is USDC managing to catch up?
Here is the chart.
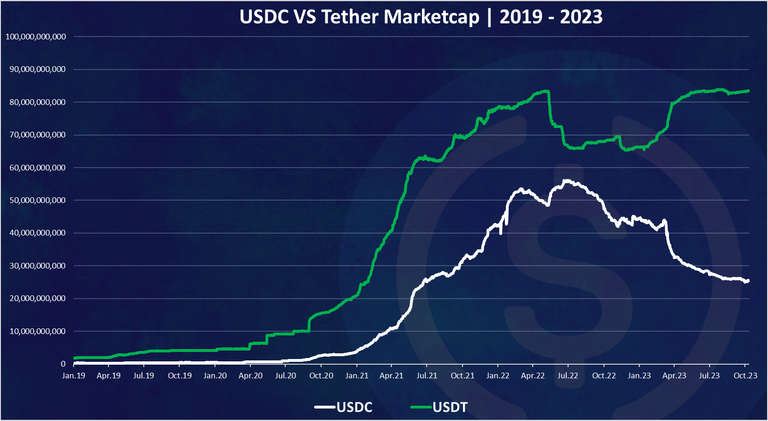
We can see that in the last period these two acts in the opposite direction. When one is going down, the other is climbing and the opposite.
Obviously, the overall growth in the industry has stopped in the last year and the same assets are being swapped around. In the last period we can notice that Tether has even stopped growing, while USDC has been going down, meaning the overall share of the stablecoins is going down.
In relative terms % the chart looks like this:
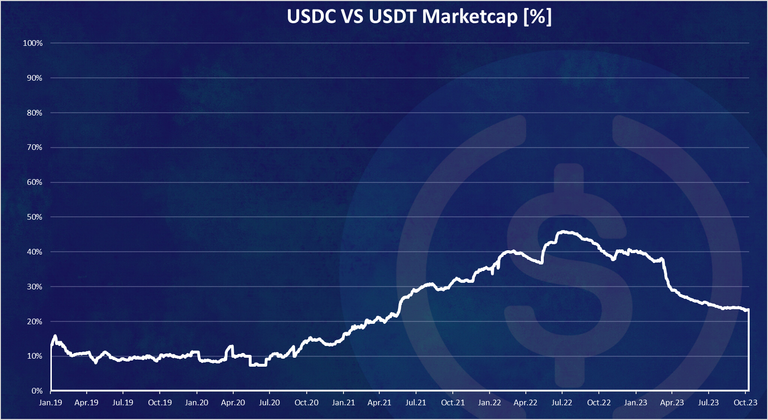
The USDC market share against Tether has been growing up until the summer of 2022, when it reached a 45% of the USDT and USDC marketcap (56B to 66B), and it was looking that at some point USDC will flip Tether, but then it lost momentum and started losing market share and now it is at 25% market share.
All the best
@dalz
Really informative.. thanks for the info
USDC supply approx. halved last year! Strange. The bear market is everywhere.
Yep ... there has been regulatory issues as well
Good to knowing USDC coin movement
USDC is pretty much a stablecoin and its marketcap is huge. Thanks for sharing details about this.
When I saw this stats, I strongly believe a bright future await HBD certainly
Thanks for the detailed analysis, i would like to see an analysis about busd in one of your next reports. can you ? there is a fud going on related to busd.
BUSD will be depriciated as it got banned from the SEC. It will keep the peg but not used in a year or two
Okay thanks for the information
https://twitter.com/LovingGirlHive/status/1712898581030752283
Looks like things are levelling off!
Still, I only hold HBD now!
Thanks for telling us about USDC
I think it is gaining more attention these days unlike before
https://twitter.com/jewellery_all/status/1712940924119265411
Gez this seriously starts to show us the major issues with liquidity that just keep getting worse it seems.
By the way we have seen that the trust of Busd is gone now people are switching their coins into other stablecoins which is also a good option for all of us.
So even USDC has been affected by the bear market. Hive might be gaining preference now.