3rd Weekly Red Candle is on Bitcoin Price Chart
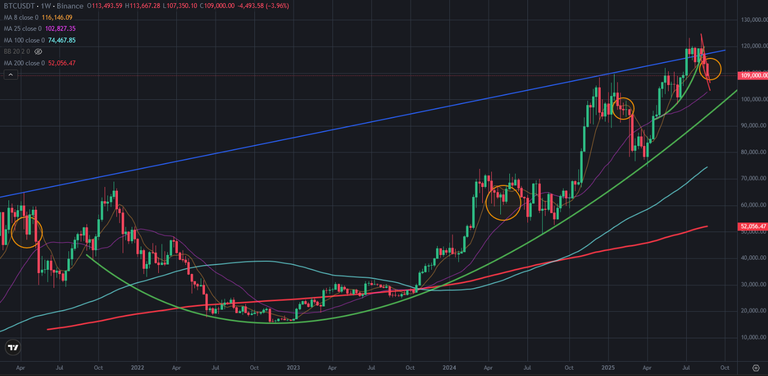
This is 3rd week that we have seen weekly red candles on Bitcoin price chart. After touching all time high level at 122K USD, Bitcoin price is going down. We have see 3 weekly red candles after all time high level. It may be a price correction.
Here you can see weekly chart of Bitcoin price. We have seen these weekly red candles series at the beginning of 2024 and 2025. We did see more weekly red candles in 2022 and 2023. There is no market crash. So, weekly red candles series may end at 3rd week.
Here you can see the indicators on weekly chart of Bitcoin price. When we look at the indicators, it was possible to see price correction on Bitcoin price chart. Because Fisher Indicator reversed down from the top. MACD Indicator also reversed from the top. There is great downtrend line on RSI Indicator. It is tested 3 times to break up.
We will see mega bullish season after Bitcoin broke up this resistance on RSI Indicator.
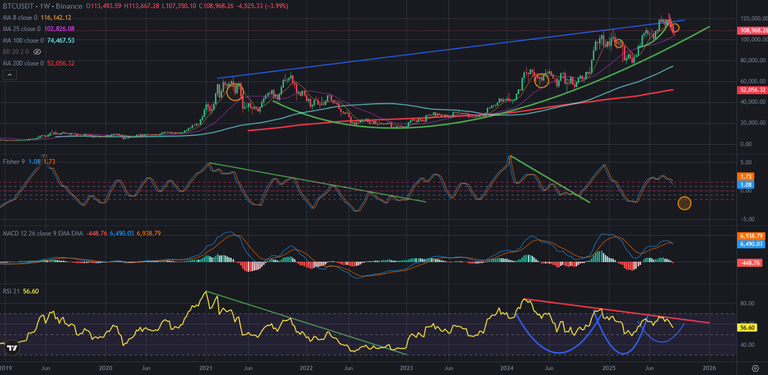
There is great pattern on RSI Indicator at weekly chart of Bitcoin price. We will see huge price pumps on Bitcoin price chart and all crypto market after breaking up this downtrend line. We should follow this trend.
We will see.
Posted Using INLEO
Looks like a normal pullback. If RSI breaks that line, what weekly close would you count as confirmation, and what would invalidate the setup for you if we get another red week?
No need for confirmation. We should see breaking up on RSI Indicator. After breaking up, Bitcoin will climb to 150K...
Fair point. For the breakout, do you want a weekly RSI close above that trendline, or is an intrawork pierce enough? What would invalidate it on RSI for you, a rejection back under the line or a move under 50 with a lower low? If it breaks clean, do you expect a quick pullback first or straight acceleration toward 150K?
We should see weekly close above the resistance of RSI Indicator. We will enter midterm bullish trend again..
Agreed. A clean weekly RSI close and hold above that resistance is my trigger too, then I’ll treat pullbacks as buys. If it rejects or RSI slips under 50 with a lower low, I’m out and will wait. Until then, patience.
!PIZZA
This post has been manually curated by @bhattg from Indiaunited community. Join us on our Discord Server.
Do you know that you can earn a passive income by delegating your Leo power to @india-leo account? We share 100 % of the curation rewards with the delegators.
100% of the rewards from this comment goes to the curator for their manual curation efforts. Please encourage the curator @bhattg by upvoting this comment and support the community by voting the posts made by @indiaunited.
Congratulations @chorock! You have completed the following achievement on the Hive blockchain And have been rewarded with New badge(s)
You can view your badges on your board and compare yourself to others in the Ranking
If you no longer want to receive notifications, reply to this comment with the word
STOPCheck out our last posts: