HBD Stats Now With a Backend and Auto Updating Charts
I have been making some improvements to the hbdstats.com page, mainly on the backend side.
Up until recently the web page was a client only, meaning there was no backend server or database for it.
The line charts for the debt and the hbd in savings were with hardcoded values and manually updated from time to time.
From a week ago this is not the case and now there is a MySQL database on the server with a express node app to get the data, create API endpoints and serve it to the web page.
API endpoints:
https://www.hbdstats.com/debt-data
https://www.hbdstats.com/savings-chart-data
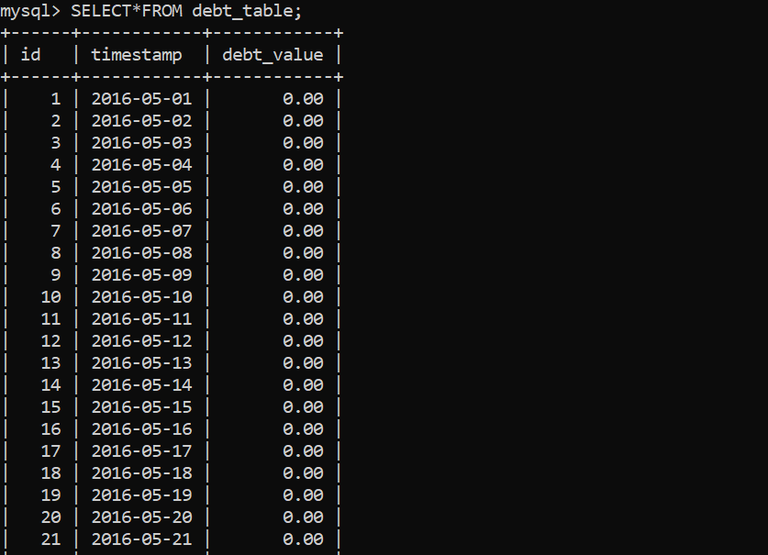
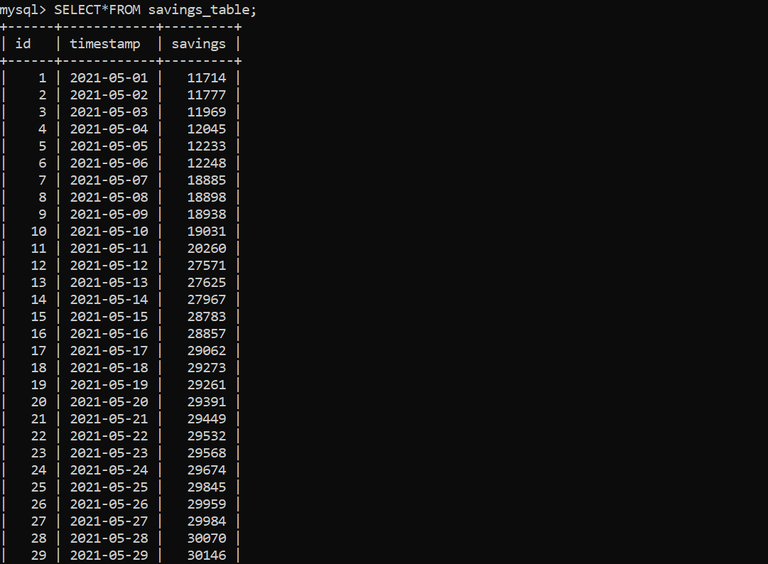
The daily values for the debt are calculated and stored daily from the web page. The data for the hbd in savings is extracted from the hivesql database and then stored on the local database daily.
Both of the line charts now have a longterm data in them.
Some screenshots.
Debt table:
Savings table:
I have also fixed some bugs and UI improvements.
There was a bug for the gauge for the hbd in savings. Occasionally it was not loading due to not properly ordered execution steps. Calculate the share first then generate the chart. It was happening that the value was not calculated and the page was trying to generate the chart. Some small UI improvements with the viewports etc.
This is a totally passionate project for me. I have built it and maintain it for free for Hivers to use it. But most of all it has been a learning experience. As most Hivers probably know I have mainly been in the data analysis side of things, this is a step further to try and build web dashboards with a full tech stack implemented.
From here on, I can easily add more features. Also, at some point I will probably upload all the code on Github/Gitlab as open source.
It’s a simple small project but works. I have intentionally tried to make it with minimalistic design, not sure how other users receive it and like it.
Please provide some feedback in the comments.
Nice work!
@tipu curate
Upvoted 👌 (Mana: 41/51) Liquid rewards.
Great work on the App.
One question, is the Hive support price correct? How can the price fall and this also goes down with it? Something doesn't math here.
It is becouse of the lower HBD supply. More HBD is being burned as the price falls. Also the way the market cap is calculated from the virtual supply, and the calculation of the virtual supply that includes all the HBD converted to HIVE.
I see, it is double counting the HBD "debt" as part of the market cap!!!
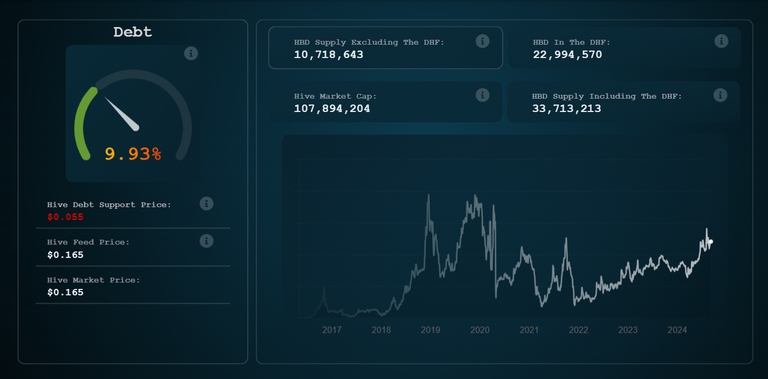
DEBT = HBD in circulation / (Virtual HIVE Supply * Feed Price)
The Market cap is being overstated and the debt ratio understated!!
Either its debt or it is equity, it cant be both!!!
Yea and this is also a base for Hive inflation ... I have been repeating that we need to replace the virtual supply from use for all hive tokenomics
Coingecko doesnt use it, why are you using it on your website?
You are overstating Marketcap by $35m and understating the debt ratio by 5% on your website
The real debt ratio is ~14,6% based on the true marketcap by coingecko.
I'm using it becouse that is how the blockchain itself works ... that is how the code for the haircut is set to be executed
But this is not the truth Dalz,those numbers are meaningless without the true context.
If HBD depegs at around $0.055, then the debt limit is nearly 45%! 15% more than what was apparently setup!
I dont make the rules obviously ... that is how it is set in the code ... code is law ... there seems to be some initiative to remove the virtual hive supply as a base for inflation in the next Hardfork also hope for this ... if that changes so will the way how debt is calculated .... I'll tag @howo and @gtg here as core devs
I understand Dalz, appreciate you explaining your figures. I still think the website app should be updated to display the true marketcap and true debt limit as those are not the true figures and are misleading/dishonest.
They are true to the blockchain and more truer than what coingecko presents ... it will be missleading if there is 15% debt shown on the web, when the blockchain itself is calculating 10% ..... if there is a change in the blockchain code I'm happy to update the numbers
The Hive Supply is onchain here: https://hivexplorer.com/api/get_dynamic_global_properties
you can then take the internal market price or binance price to make your calculation. That is the ONLY calculation for marketcap.
If you dont want to have the true marketcap in the app, then you should remove "marketcap" from your website as that ISNT it! It is an abstract calculation with no meaning/value and you should add a disclaimer for transparency.
This usage of terms/numbers are just wrong and deliberately misleading Dalz, you know that.
I'm very awere how things are, and as I have said at the beging of our conversatio here above I dont like it and I have been rumbling about this that you are noticing just now for years ... on chain and in private.
And as far as it goes for the web app that is just following on chain rulles, there is litteraly a info sign next to every box, including the market cap and you can hover over it and see details, something similar with what you have written above
P.S. Here is a post of mine, from two years ago on the topic
https://hive.blog/hbd/@dalz/should-the-hbd-in-the-dhf-be-excluded-from-the-hive-virtual-supply-or-pro-and-cons
Well, thank you for bringing this up; @mypathtofire and @dalz, let me upvote it (post and thread) for more visibility = discussion, upcoming HiveFest is a good opportunity to talk on that matter too.
Just an aside, have you noticed HBD and jumped above SBD in market cap according to coingecko.
Keep up the good work, I love reading about statistics.
Best wishes :-)
It’s really a good tool, I really like the minimalistic approach
Thansk!
Is there any other info, or chart you want to see for hbd, added here?
perhaps would be good to build a chart showing the relation between HBD that is being used (for APR in savings or proposals payments) and the Debt in a graphical manner...
Something like this:
Or this:
I love this 2 charts!
Could it be the 2nd chart including savings?
The app neat and smooth. Simple to use !
Congratulations @dalz! You have completed the following achievement on the Hive blockchain And have been rewarded with New badge(s)
Your next target is to reach 1100 posts.
Your next payout target is 70000 HP.
The unit is Hive Power equivalent because post and comment rewards can be split into HP and HBD
You can view your badges on your board and compare yourself to others in the Ranking
If you no longer want to receive notifications, reply to this comment with the word
STOPCheck out our last posts:
You are really doing a very great work on the app
Thank you for the update
This is a great work in the application
It is useful
Cool! thanks for updating the website @dalz!
Great update! The auto-updating charts and backend improvements make the site even more useful for tracking HBD data in real-time.
It seems Hive is still able to maintain the peg at this point, which is pretty cool.
Yes it has mobile view as well :)