How Do You Trade Based Off An Index? More Rate Cuts for the Philippines In Line with Low Inflation.
Philippine Market
A reminder to myself that I should be looking not just at the Daily chart but also weekly, especially since I'm not a day trader.
While I do trade stocks and crypto, I still rather trade with volume based on an index than an individual asset, unless I have very strong conviction on one (which is rarely the case).
The Philippine market has been underperforming for years since the pandemic. Still waiting for a catalyst to make it bullish again.
Daily Chart
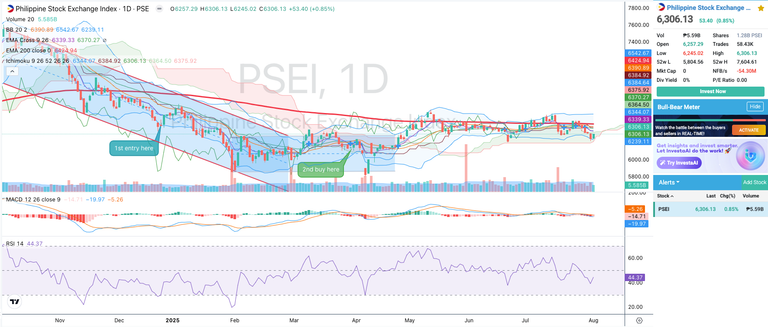
I've been using the daily chart extensively in my weekly blogs. Above you can see 2 points on when I bought into a Fund tracking the PSEI. Both of which I bought because I thought it was oversold (rebound from oversold region 2x) and is now inching towards getting bullish.
Weekly Chart
Maybe a better buy signal would be basing on the weekly chart instead? The EMA 9-26 cross seems reliable. If I follow this signal, it means I should buy the market since last month ago. Although it's trading at a very tight range right now, so there is a high tendency of ups and downs as we see right now. Just a week after, Sell signal triggered (EMA9< EMA26 for weekly chart).
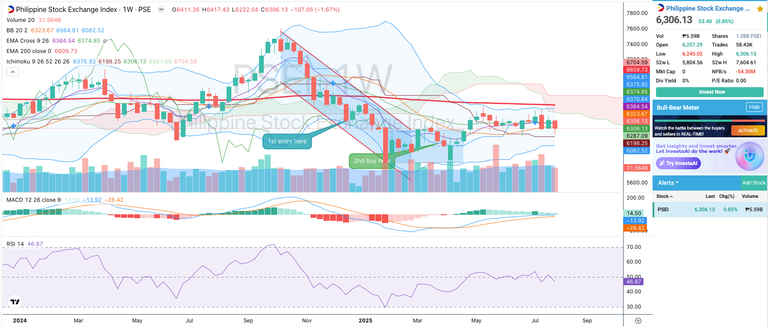
PSE Index now touching the lower bands of the Bollinger bands and also about to cross the kumo towards negative region. Doesn't look good. Seems like we are to see a correction and further consolidation. I'll pass on buying for now though. Let's get back again next week!
Philippine Market Fundamentals
i.) Rate cuts not helping the stock market much.
Benchmark rates reduced to 5.25% last June. Possible 2 more rate cuts in the coming months
ii.) Low inflation rate at 1.4% (June)
This is actually amazing, but why is the market not biting it? Maybe just needs more time.
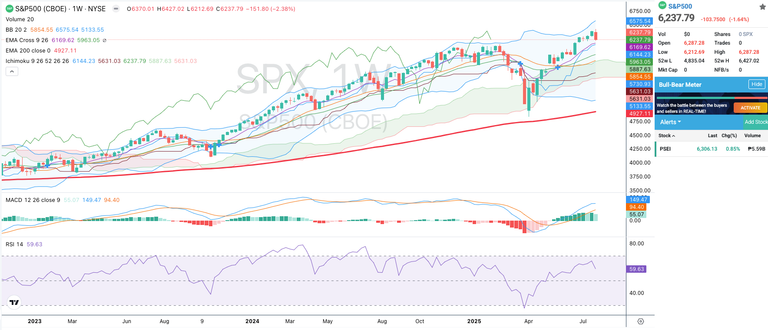
US Market
Hindsight is 20/20. Missed the train here since I see a buy signal around 2 months ago. Let's just wait for a dip then.
Crypto (Hive)
Now looking into the Weekly chart for Hive as well, I'm seeing that last week's Hive prices have weakened. It's now even trading within a tight bollinger range, so there is a risk to go down further as it sits on the lower band.
===============================================================================
Summary/My Action:
PH market -Wait and See this week. Look more closely into PH banks who can benefit a lot from the lowering further of rates.
Hive - Wait and See and hope that it bounces up ths week.
US market - I guess a missed the train on this one. Won't buy at current levels; awaiting some correction/consolidation.
This is not financial advise. I use this as my trading journal/notes for ongoing reference for the succeeding week. The above technical analysis (charts) are just used for guidance while studying market behavior and trying my hand on market timing. Please Do Your Own Research (DYOR).
- Stock Charts from Investagrams
I didn't quite understand that.
Apologies... which part? I'd be happy to clarify. :)
Congratulations @scion02b! You have completed the following achievement on the Hive blockchain And have been rewarded with New badge(s)
Your next target is to reach 800 comments.
You can view your badges on your board and compare yourself to others in the Ranking
If you no longer want to receive notifications, reply to this comment with the word
STOPCongratulations @scion02b! You received a personal badge!
You can view your badges on your board and compare yourself to others in the Ranking
Congratulations @scion02b! You received a personal badge!
Wait until the end of Power Up Day to find out the size of your Power-Bee.
May the Hive Power be with you!
You can view your badges on your board and compare yourself to others in the Ranking
Check out our last posts:
Congratulations @scion02b! You received a personal badge!
Participate in the next Power Up Day and try to power-up more HIVE to get a bigger Power-Bee.
May the Hive Power be with you!
You can view your badges on your board and compare yourself to others in the Ranking
Check out our last posts: