Gold And Silver Movement in the Past Three Days
Silver’s recent trajectory reveals a nuanced balance between profit-taking and resilient support. On August 19, silver hovered around $37.38 per ounce after several days of minor upward advances but faced pressure from profit-taking that led to a slight dip. The day’s session indicated a potential classic "Head and Shoulders" pattern forming, which technical analysts interpret as a cautionary signal for a possible retracement. The measured move from such a pattern targets a decline toward the 200-day moving average, roughly between $32 and $32.50.
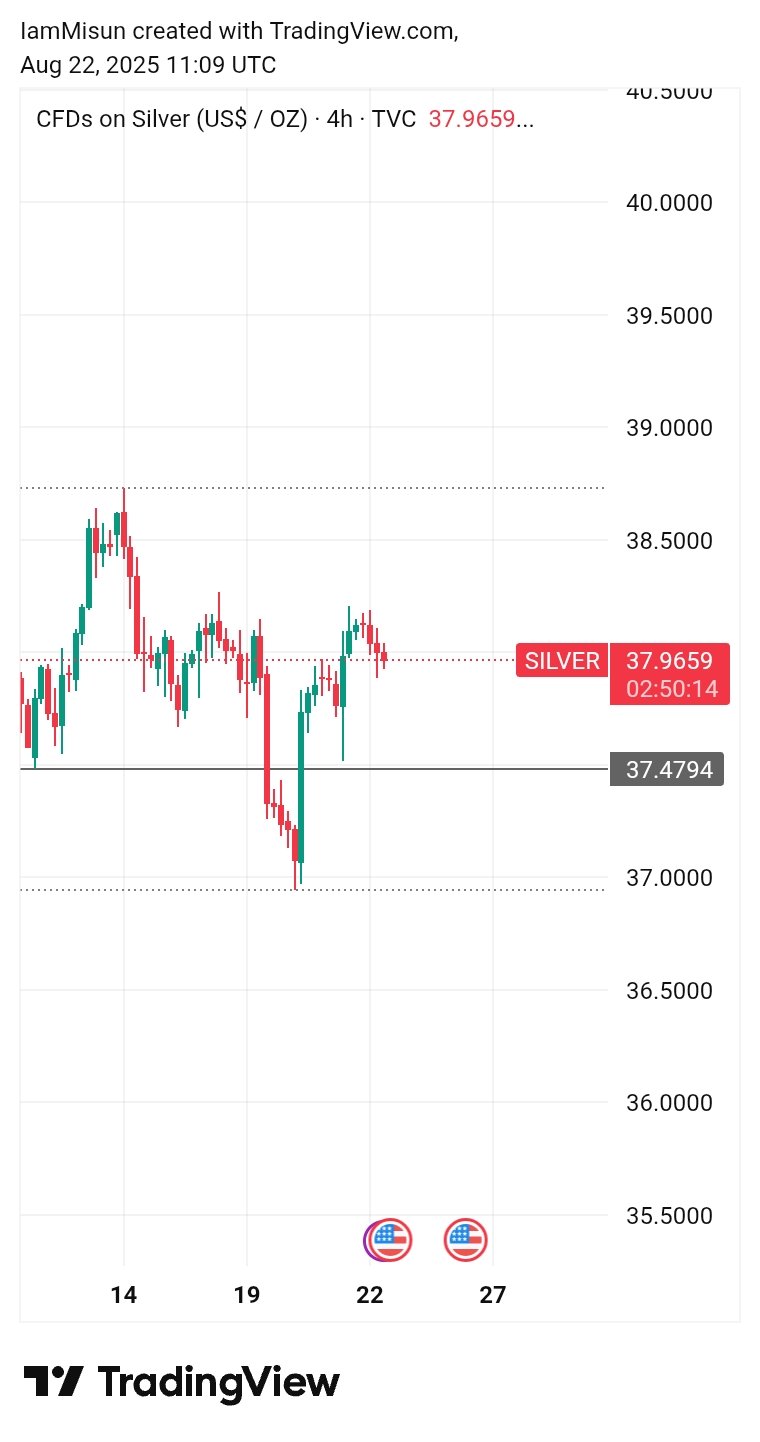
Yet, the metal showed resilience by testing and holding above the intermediate support near the 50-day moving average at around $37.30. On August 20 and 21, silver modestly rebounded, trading just above $38.00, buoyed by renewed demand from ETFs and a partially steadied inflation outlook that keeps interest rate cut expectations alive globally. However, by August 22, silver edged slightly lower to $38.03, down 0.34%, portraying cautious investor positioning ahead of key economic data releases and central bank communications. Overall, silver maintained an upward channel that began mid-2024 but is currently navigating a corrective phase amid fading geopolitical tensions and evolving central bank rate expectations. This behaviour reflects a maturing rally where traders consolidate gains and position themselves for the next directional move .
Gold over the same three-day frame has been anchored within a broader upward trend but experienced a mild bearish correction phase. On August 19, gold traded near $3,329 per ounce, retreating slightly from recent highs as investors digested geopolitical tensions and awaited fresh cues from global economic policies.
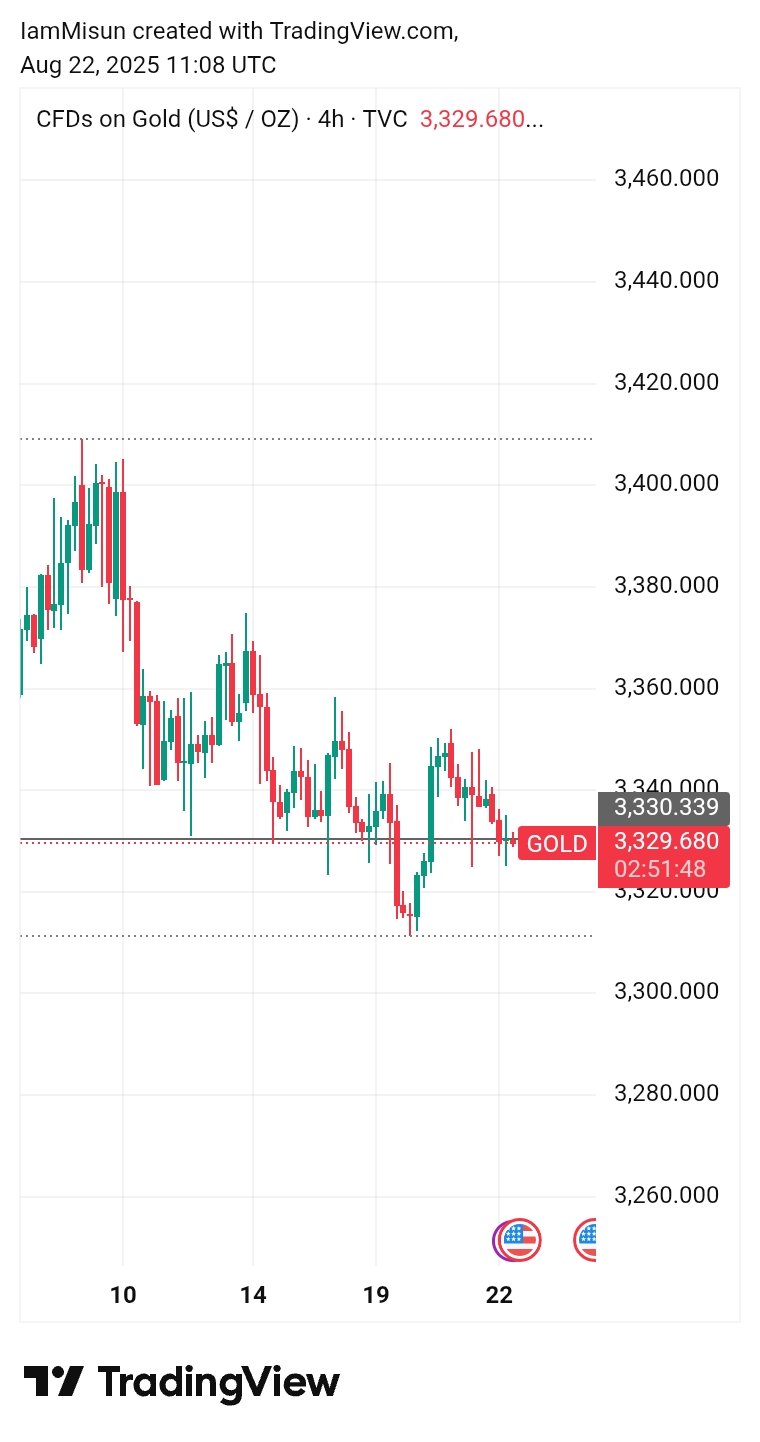
Throughout August 20 and 21, gold fluctuated near the $3,330-$3,350 range, influenced by mixed signals from technical indicators such as the relative strength index (RSI) and moving averages, which suggest a tentative “Triangle” consolidation pattern. By August 22, gold settled around $3,330, down roughly 0.28% from the previous day, reflecting short-term profit-taking without disrupting the medium-term bullish structure. Market analysis highlights a test of key support near $3,295, a level that, if breached, may signal deeper correction toward $2,865. However, sustained rebounds from current support zones and the bullish trend line on RSI indicate the probability of a continued ascent targeting levels above $3,800 in the medium term. The metal’s movement also mirrors investor appetite for safe-havens amid fluctuations in global trade dynamics, inflation expectations, and monetary policies. It remains one of the most closely watched assets for signs of directional shifts amidst the complex interplay of market forces .
View or trade
LOHtokens.@misun, You have received 1.0000 LOH for posting to Ladies of Hive.
We believe that you should be rewarded for the time and effort spent in creating articles. The goal is to encourage token holders to accumulate and hodl LOH tokens over a long period of time.
On the other side of the Reset, the Melt Values of Silver and Gold will go as high as $9 and $90… To convert todays Prices to after Reset Prices, just Divide todays Prices by 100…. This will let you know if Silver and Gold are Currently selling at Bargain Prices…