How old are the active accounts? - Wie alt sind die aktiven Accounts?
EN (DE unten)
Hello dear community, I have once again created a post with @hive-coding on the topic of activity on Hive.
After looking at the number of accounts and the number of posts, I wanted to know how old the accounts that write posts are.
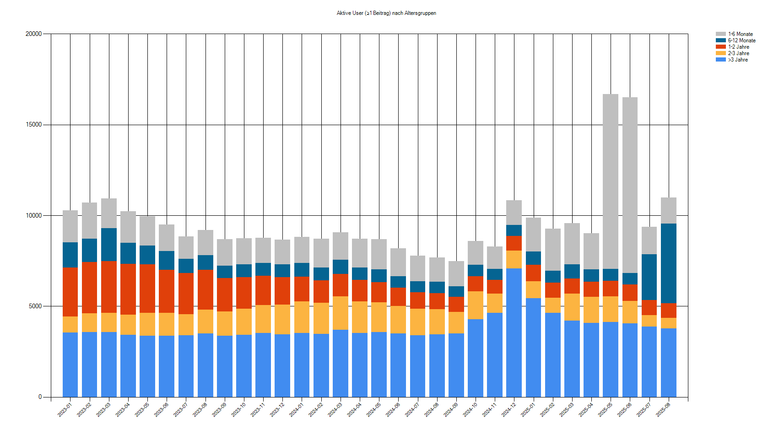
at least 1 post
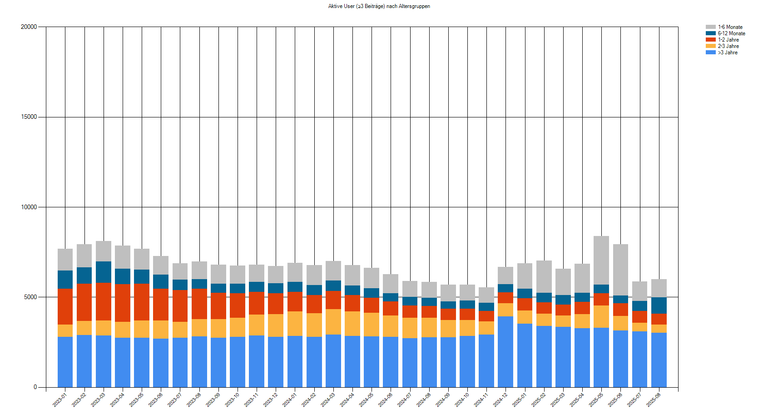
at least 3 posts
at least 10 posts
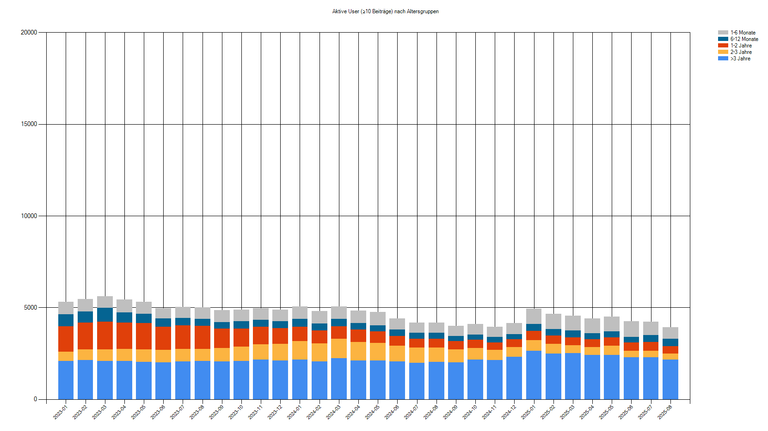
I divided age into 6 groups and again into three activity levels: at least 1 post, at least 3 posts, and at least 10 posts.
I chose the period starting in 2023 so that more can be seen and interpreted.
Unfortunately, there is no clear interpretation for these graphs unless you dig deeper into the data. Actually, the lower range should become larger over time, not smaller. There was only a small spike here a few months ago. Over time, new accounts become older and eventually end up in the lower range.
Two possible interpretations:
- New accounts lose interest early on and are no longer active after 2-3 years.
- Old users lose interest and are no longer active.
Does anyone have any ideas on how best to investigate this? I have an idea and will try to test it out soon. What do you think of the graphs, and how do you interpret them?
DE
Hallo liebe Community, ich habe mit @hive-coding mal wieder einen Beitrag erstellt zum Thema Aktivität auf Hive.
Ich wollte nun wissen, wie alt die Accounts sind, die Beiträge schreiben, nachdem ich, die Anzahl der Accounts und die Zahl der Posts mir angeguckt hatte.
mindestens 1 Post
mindestens 3 Posts
mindestens 10 Posts
Da Alter habe ich in 6 Gruppen eingeteilt und wieder drei Aktivitätsstufen, mind. 1 Post, mind. 3 Posts und mind. 10 Posts.
Den Zeitraum habe ich nun ab 2023 gewählt, damit man mehr sehen und interpretieren kann.
Leider gibt es keine eindeutige Interpretation für diese Grafiken, wenn man nicht noch tiefer in die Daten hereingeht. Eigentlich müsste der untere Bereich mit der Zeit immer größer werden, statt weniger. Hier gab es nur vor paar Monaten einen kleinen Ausbruch. Mit der Zeit werden ja die neuen Accounts immer älter und sind dann irgendwann in dem unteren Bereich.
Zwei mögliche Interpretationen:
- Neue Accounts verlieren vorher die Lust und sind dann nach 2-3 Jahren nicht mehr aktiv.
- Alte User verlieren die Lust und sind nicht aktiv.
Wer hat denn eine Idee, wie man das am besten abfragen könnte? Eine Idee habe ich und werde demnächst mal versuchen das zu prüfen. Was sagt ihr zu den Grafiken, was ist eure Interpretation dazu?
Posted Using INLEO
I guess what you want to know is the retention of users. If that's the case, you can use the same metric (1 post per month, up to 10, more than 10) but look at the data from the signup month perspective (meaning the cohorts). So you would plot the number of users who signed up in, say, September for every month starting from September, do the same for users who signed up in October, etc.
A bar chart won't work that well, I'd suggest using a regular line chart.
Unfortunately hive can't retain it's users because of hivewatcher and thier team with thier rediculious standards, trying to use web 2 infrastructure for Web3