The Effects Of The new UI | More Threads Less Inflation | LeoFinance Weekly Stats 05/01/2023 to 05/07/2023
Welcome to the weekly edition of the LeoFinance stats report.
This is a weekly report covering May 1 through 7, 2023.
If you want to learn a bit more about the LeoFinance ecosystem and dig into the numbers, this is the place to be.

The following topics will be covered:
- Issued LEO Tokens
- Top LEO Earners
- Rewards to HP delegators trough the leo.bounties program
- Daily stats on tokens staking
- Share of tokens staked
- Top Users that staked
- Unique number of LeoFInance users
- Posts/comments activities on the platform
- Posting from LeoFinance.io interface
- Price Chart
Issued LEO Tokens
Let’s take a look into token issuance and how it is distributed over time.
Below is a chart that represents the cumulative issued LEO tokens.
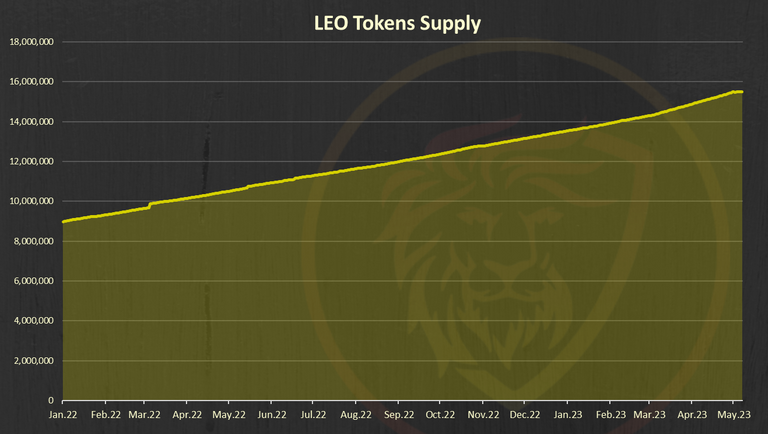
This chart is representing the total LEO supply, circulating supply and burned tokens.
A total of 15.5M circulating supply.
Next is the issued LEO tokens from last week. Here is the chart:
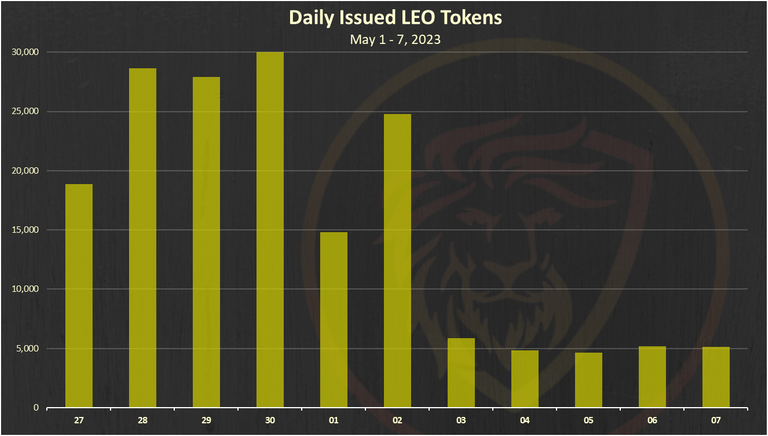
Usually this is a weekly chart, but I have added a fed day from the previous week for comparison. As we can see the daily issuance has dropped a lot. From more than 20k per day to around 5k tokens per day. This is because of the implementation of new mechanics for the bounty rewards.
On top of this there has been a major burn event in the last week with a 48k LEO, that has reduced the supply even more.
It remains to be seen how will this play out in the future but if the initial numbers hold, we can even see a deflationary LEO tokenomics.
Let’s see how these tokens were distributed.
Below is the chart of the top 10 LEO earners this week.
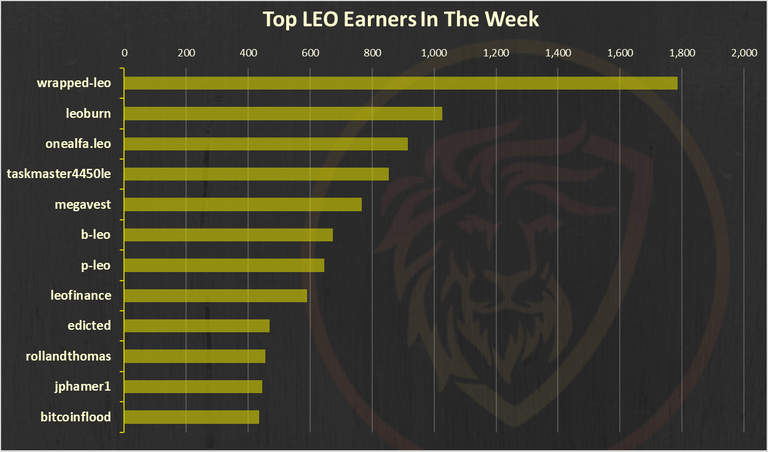
The @wrapped-leo account is on the top here.
Rewards from Bounties
Users who delegate their HP to the @leo.voter receive daily payouts in the form of LEO tokens at a rate of 16% APR. Also, at time some other bounties are in place.
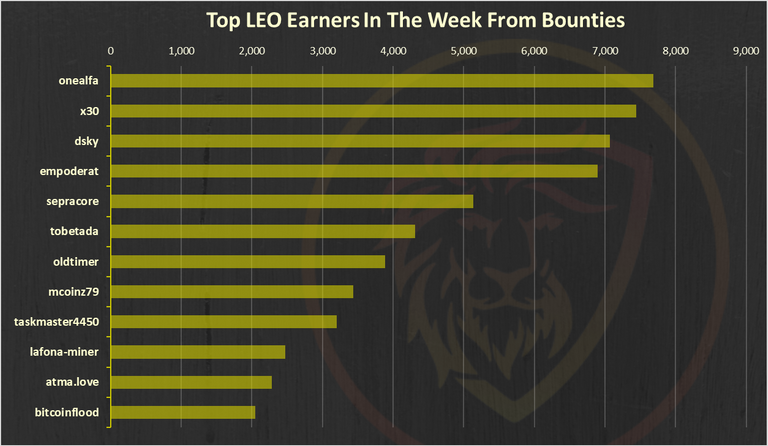
@onealfa is on the top here.
Staking LEO
Below is a chart that represents the monthly flow of staked and unstaked LEO tokens. A positive bar going up shows a day where more LEO was staked than unstaked.
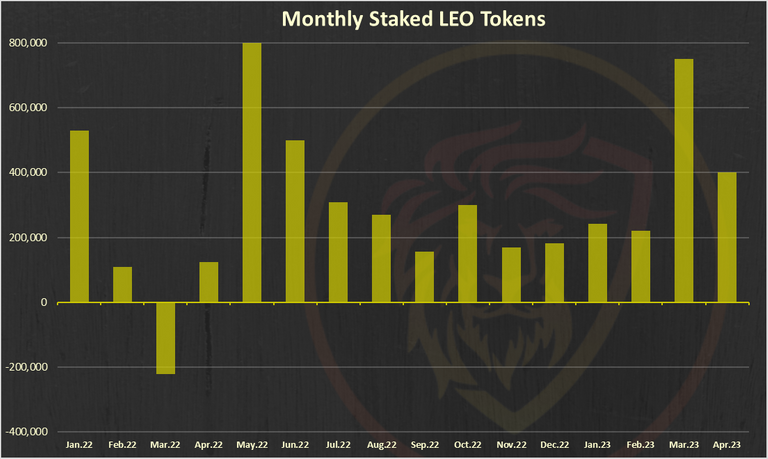
April has a 400k LEO staked.
Below is the chart of the top 10 users that staked LEO last week:
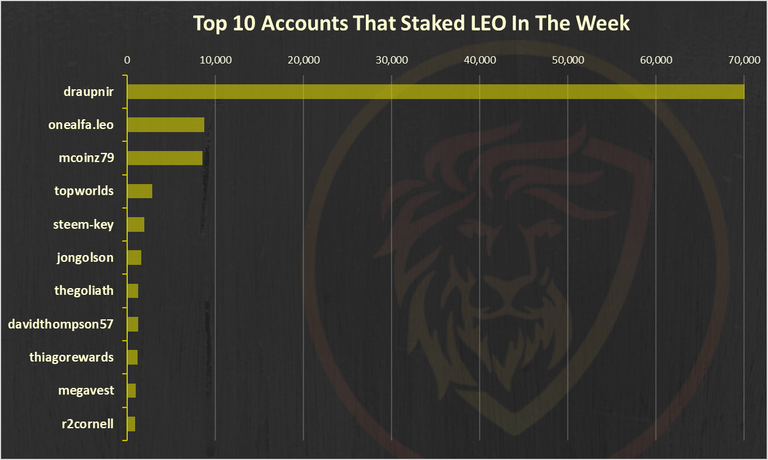
@draupnir is on the top here.
Liquid VS Staked:
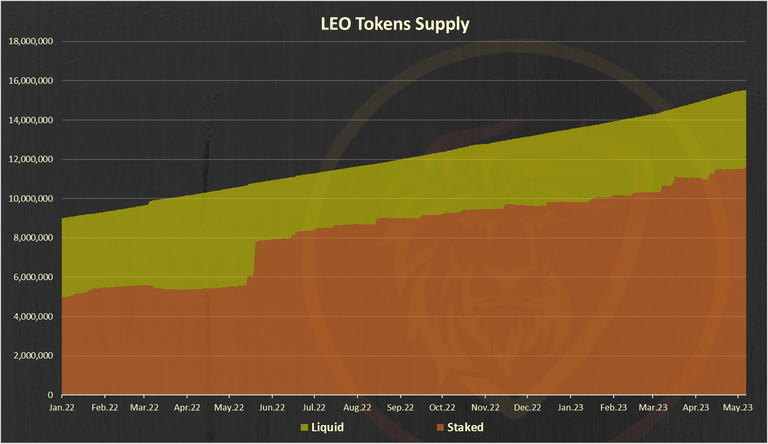
Note on the yellow, liquid category above. It includes the LEO in the liquidity pools on ETH and BSC as well. If we remove that, the liquidity will be much lower.
Below is a chart of the LEO tokens allocation.
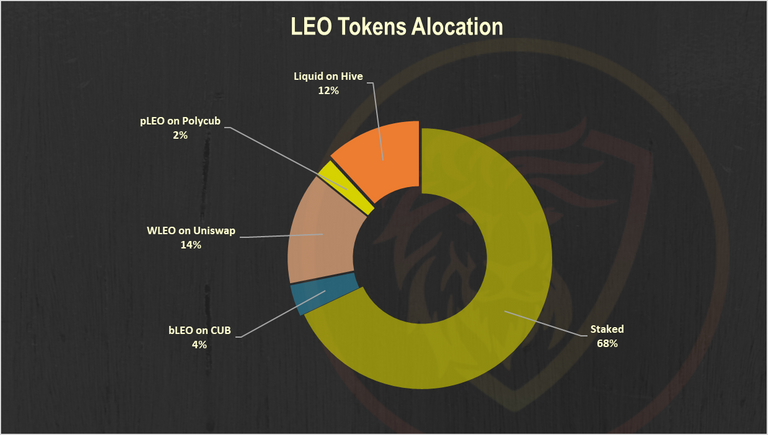
A 68% share staked.
LeoFinance Users
Below is a chart with the number of unique users that posted from the LeoFinance frontend.
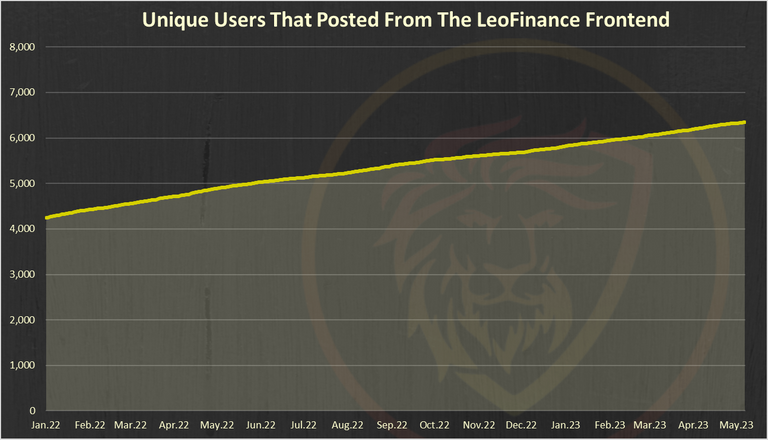
A 6.3k unique accounts have posted from the LeoFinance.
Monthly Active Users Posting and Commenting from LeoFInance [MAU]
Here is the chart for the monthly active users combined from the legacy UI leofinance.io and the new threads UI.
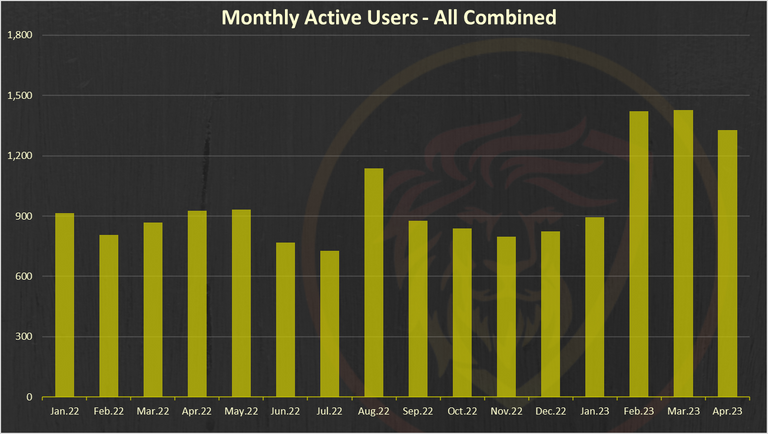
April has 1327 MAUs, a small drop from the 1400 MAUs in the previous month.
Threads MAUs
What about threads only? How are the numbers doing here? Here is the chart.
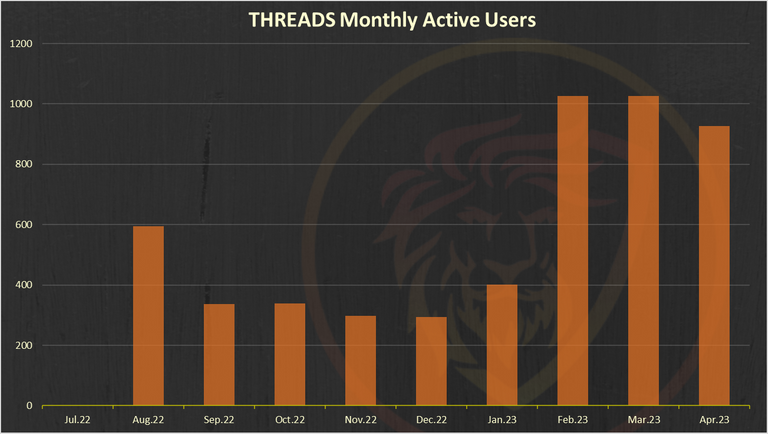
The first version of threads was launched back in August 2022, and there were around 600 MAUs. This number dropped in the months that followed, but then increased again to a new ATH in February 2023 with the release of the threads UI.
April is having a small drop compared to March.
Posts, Comments and Threads
Here is the chart.
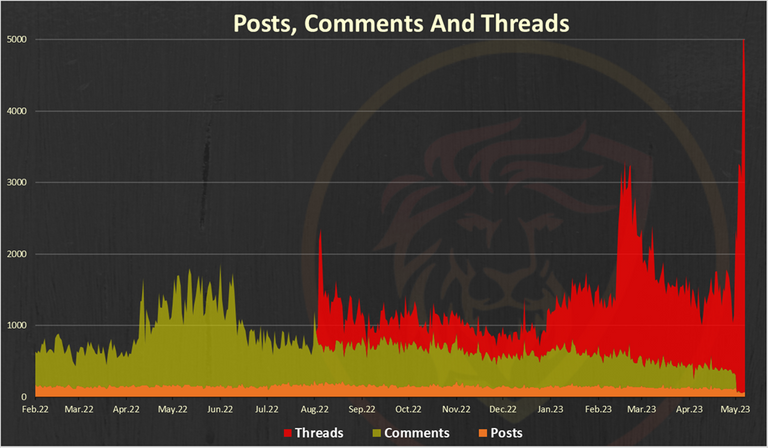
Well, this chart is obviously telling. An aggressive growth in activity since the launch of the new UI in production. A new ATH for number of threads.
In summary last week’s looks like this:
- 500 posts
- 24k threads
The number of posts has dropped a bit from 900 to 500 on a weekly basis. This is because the new UI is mostly short form focused, but there are also new features that need to be added for the long form.
But when it comes to threads the numbers have x3, from around 8k to 24k.
We can notice a small uptrend in the last week.
Top Threads Creators
Here is the chart.
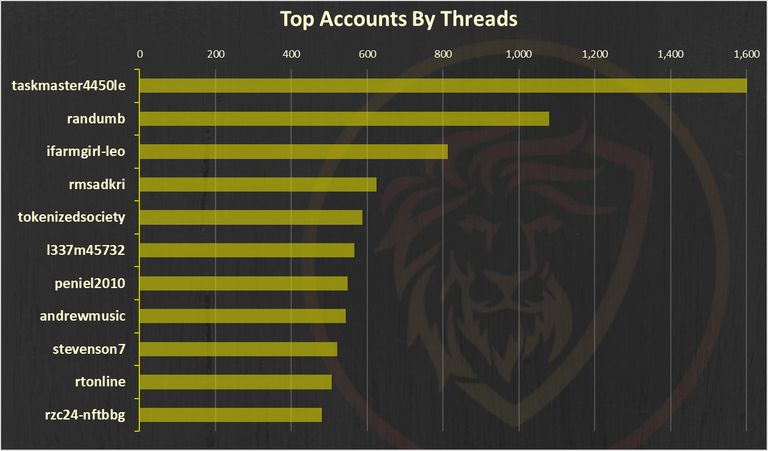
@taskmaster4450le is on the top here with an amazing 1600 threads in the week followed by @randumb.
Price
Here is the price chart in dollar value with average price.
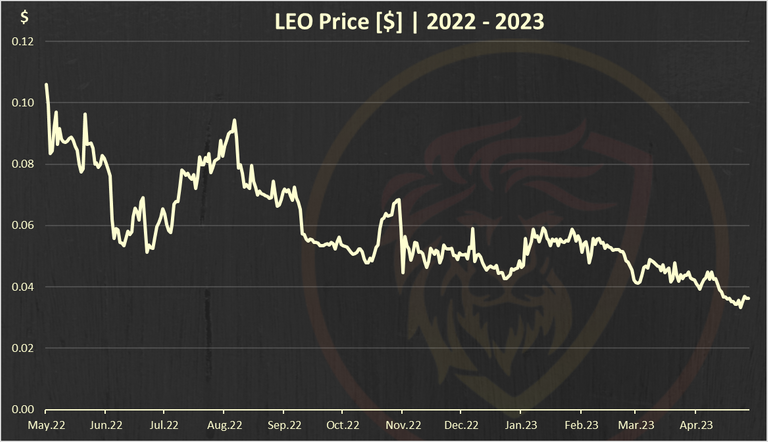
We can see that the LEO token is slowly bottoming in out around the 3.5 cents.

| Track Hive Data | New Interface! | About Us |
|---|---|---|
| Hivestats | LeoFinance Beta | Learn More |
 |  |  |
| Trade Hive Tokens | Wrapped LEO | Hive Witness |
|---|---|---|
| LeoDex | Trade on Uniswap | Vote |
 |  |  |

Report by @dalz
https://leofinance.io/threads/view/sammyhive/re-leothreads-2nj5upfvr
The rewards earned on this comment will go directly to the people ( sammyhive ) sharing the post on LeoThreads,LikeTu,dBuzz.
Terrific figures this time with threads. We're enroute 5,000 threads daily.
Such bullish on new tokenomics
Indeed :)
Good stuff! 🙂