LeoFinance Weekly Stats 06/26/2023 to 07/02/2023
Welcome to the weekly edition of the LeoFinance stats report.
This is a weekly report covering June 26 through July 2, 2023.
If you want to learn a bit more about the LeoFinance ecosystem and dig into the numbers, this is the place to be.

The following topics will be covered:
- Issued LEO Tokens
- Top LEO Earners
- Rewards to HP delegators trough the leo.bounties program
- Daily stats on tokens staking
- Share of tokens staked
- Top Users that staked
- Unique number of LeoFInance users
- Posts/comments activities on the platform
- Posting from LeoFinance.io interface
- Price Chart
Issued LEO Tokens
Let’s take a look into token issuance and how it is distributed over time.
Below is a chart that represents the cumulative issued LEO tokens.
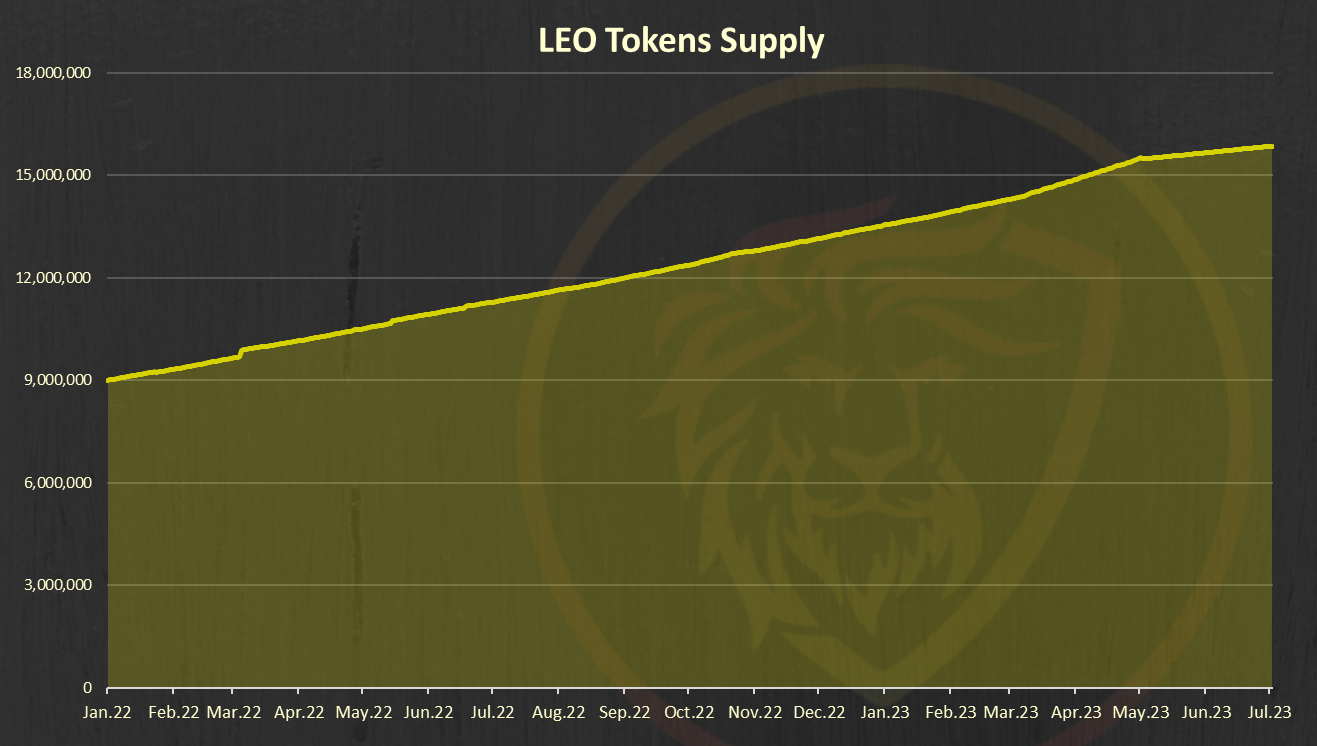
This chart is representing the total LEO supply, circulating supply and burned tokens.
A total of 15.9M circulating supply.
Next is the issued LEO tokens from last week. Here is the chart:
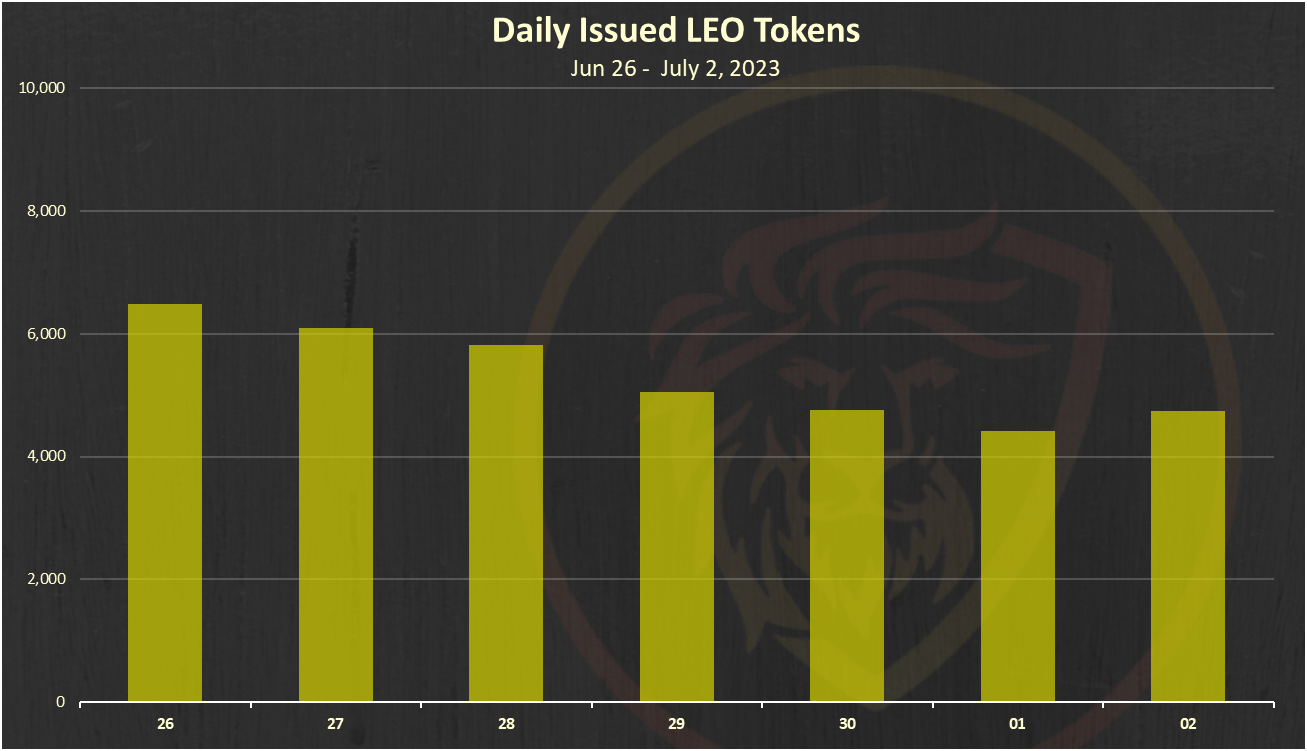
The amount of daily LEO issued is now around 6k per day, down from the previous 20k or more.
Let’s see how these tokens were distributed.
Below is the chart of the top 10 LEO earners this week.
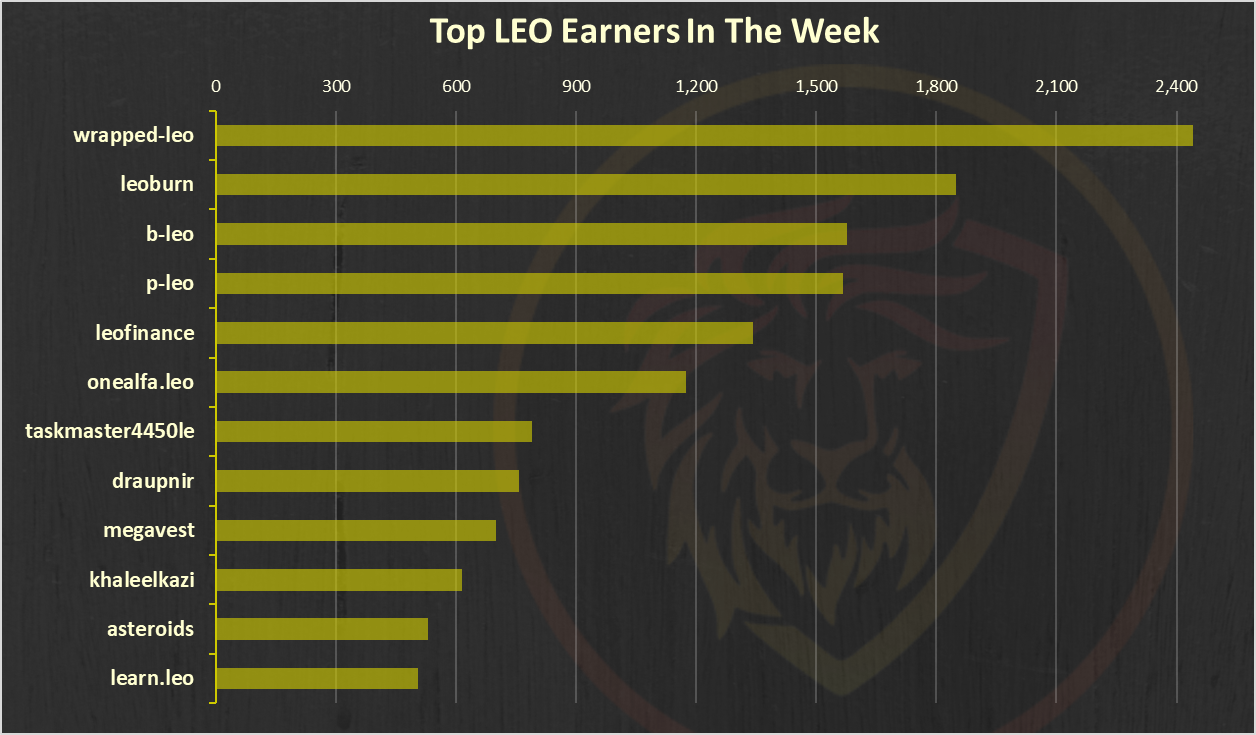
The @wrapped-leo account is on the top here. This account holds the wrapped LEO on Ethereum.
Rewards from Bounties
Users who delegate their HP to the @leo.voter receive daily payouts in the form of LEO tokens at a rate of 16% APR. Also, at time some other bounties are in place.
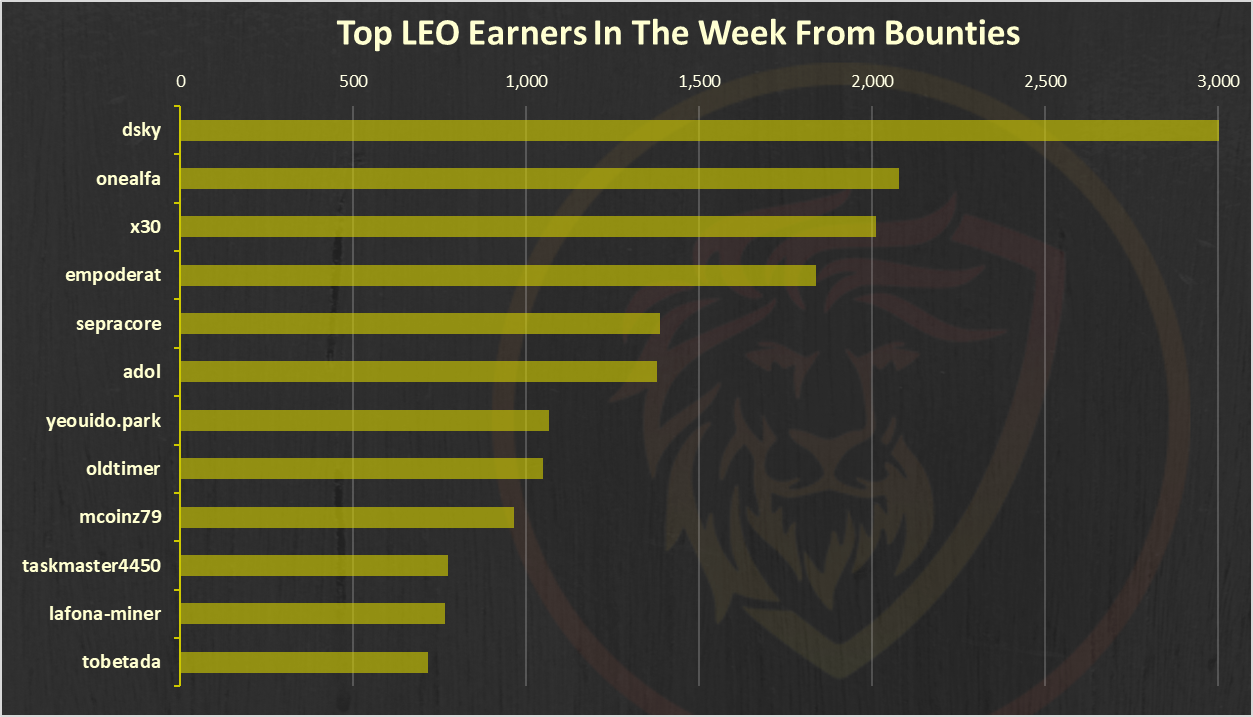
@dsky is on the top here.
Staking LEO
Below is a chart that represents the monthly flow of staked and unstaked LEO tokens. A positive bar going up shows a day where more LEO was staked than unstaked.
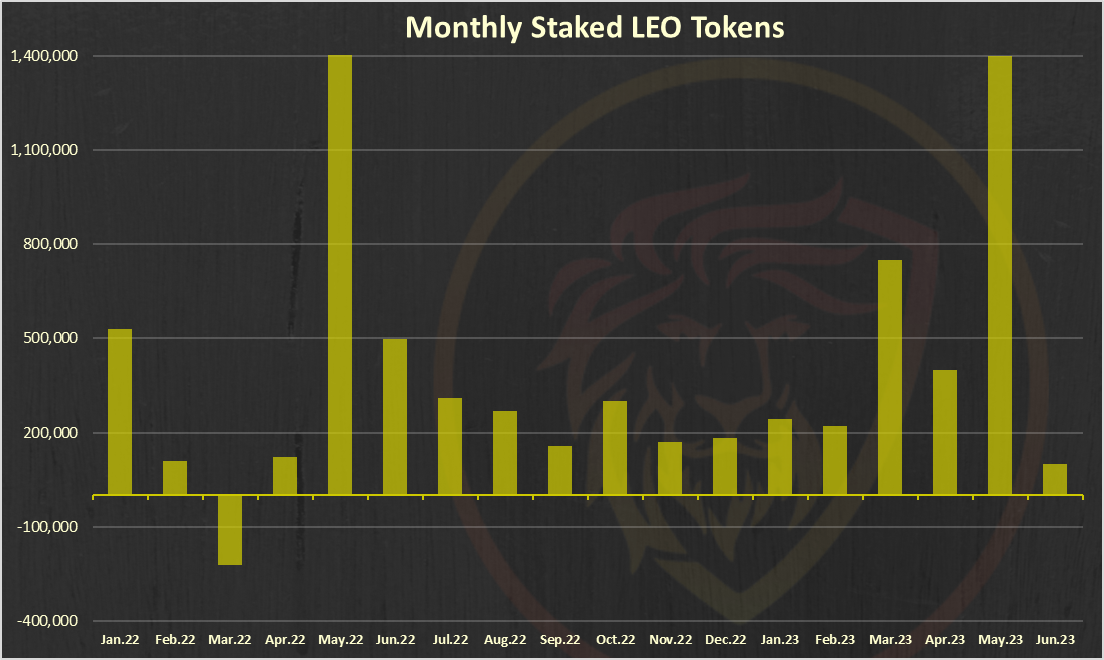
June is slightly positive after a massive staked LEO in May.
Below is the chart of the top 10 users that staked LEO last week:
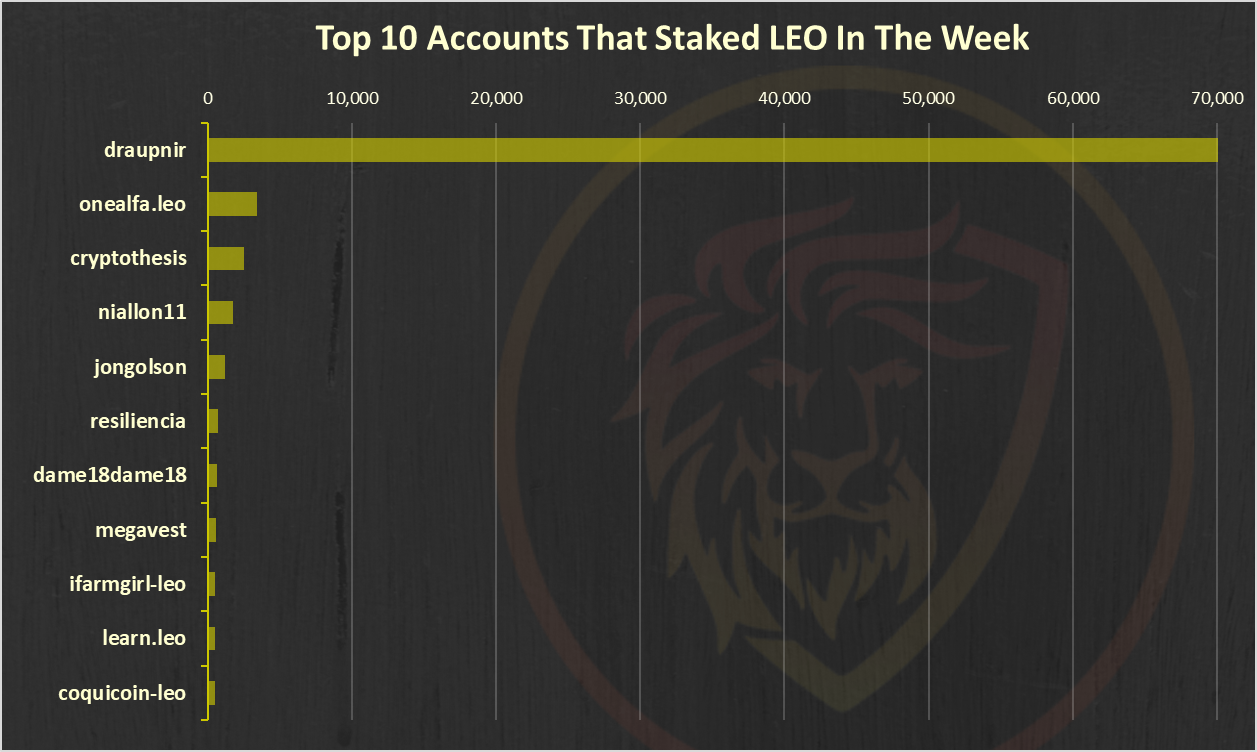
@draunpnir is on the top here.
Liquid VS Staked:
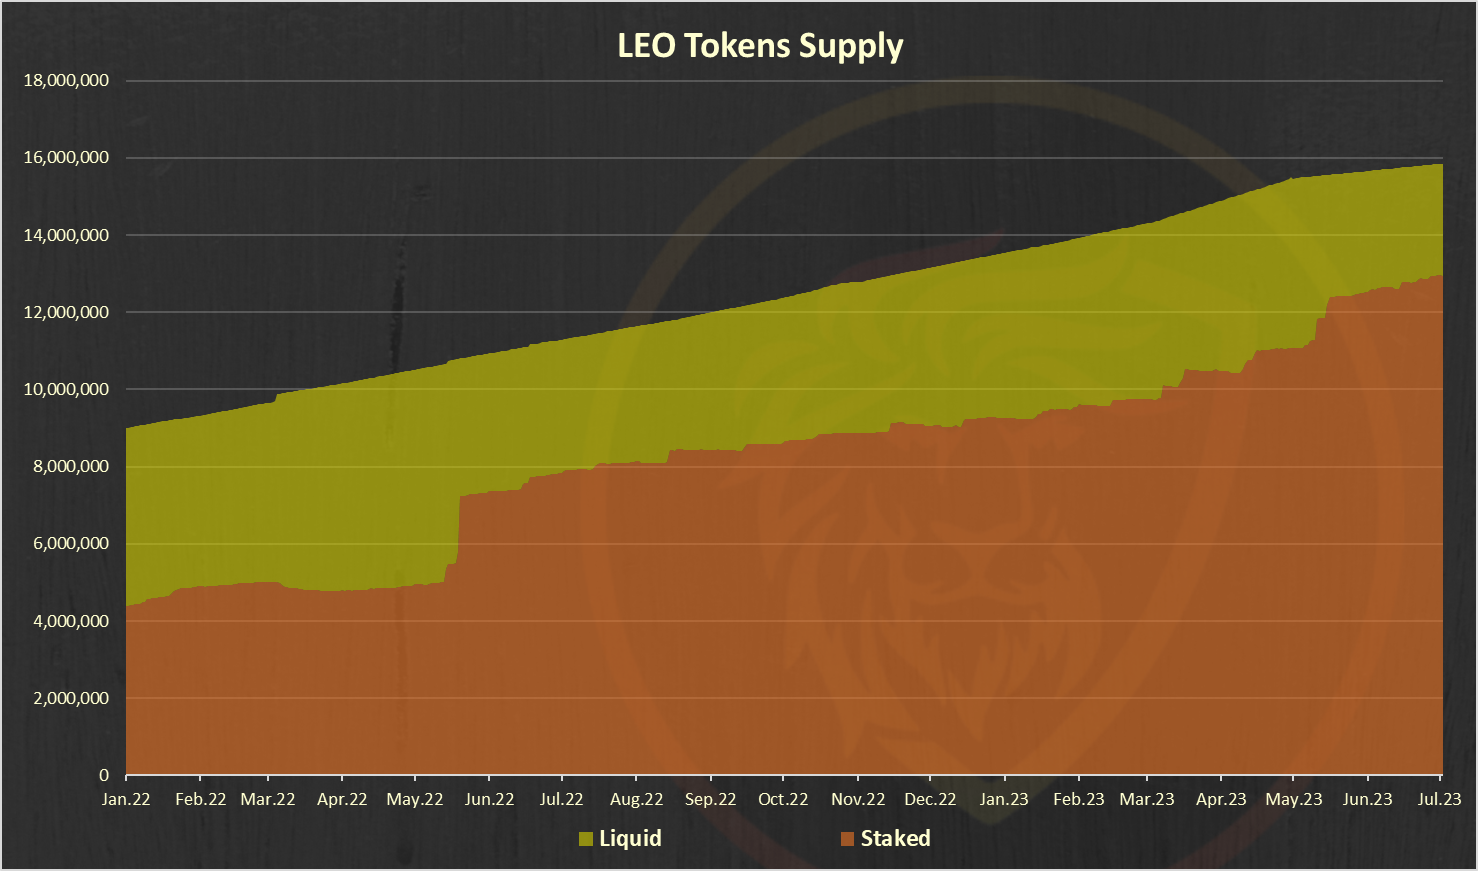
Note on the yellow, liquid category above. It includes the LEO in the liquidity pools on ETH and BSC as well. If we remove that, the liquidity will be much lower.
The share of the liquid LEO tokens has been going down.
Below is a chart of the LEO tokens allocation.
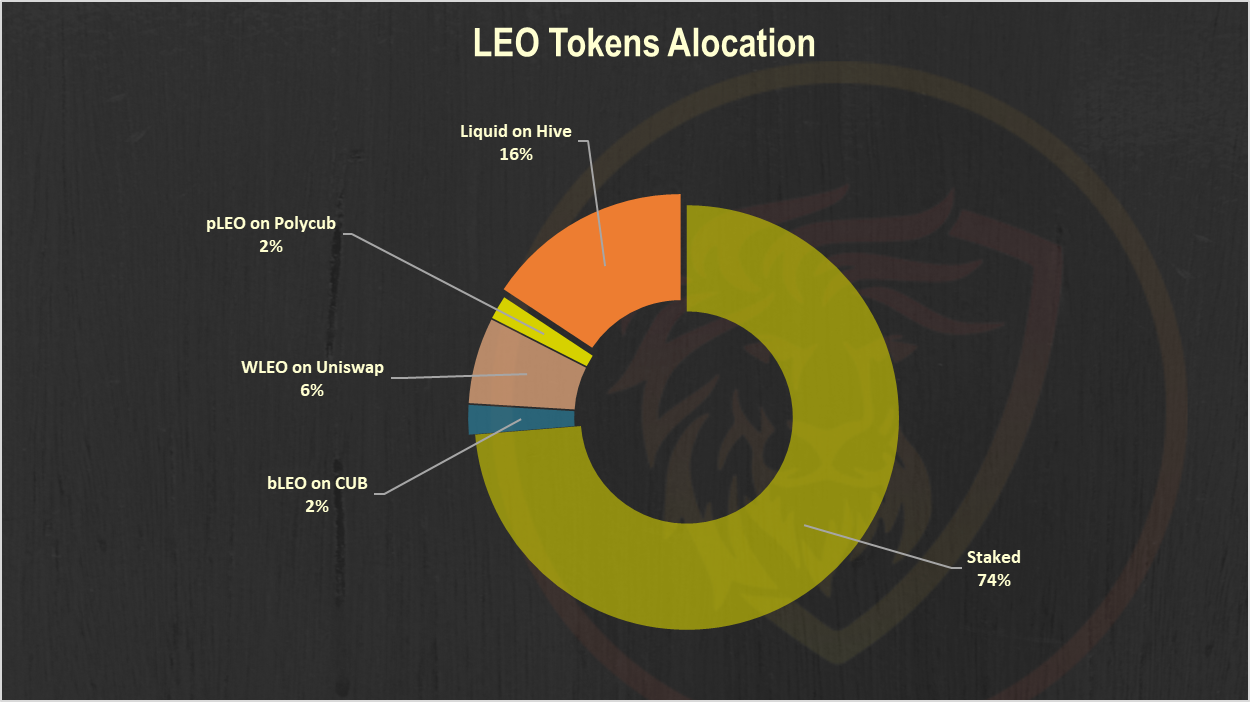
A 74% LEO staked.
LeoFinance Users
Below is a chart with the number of unique users that posted from the LeoFinance frontend.
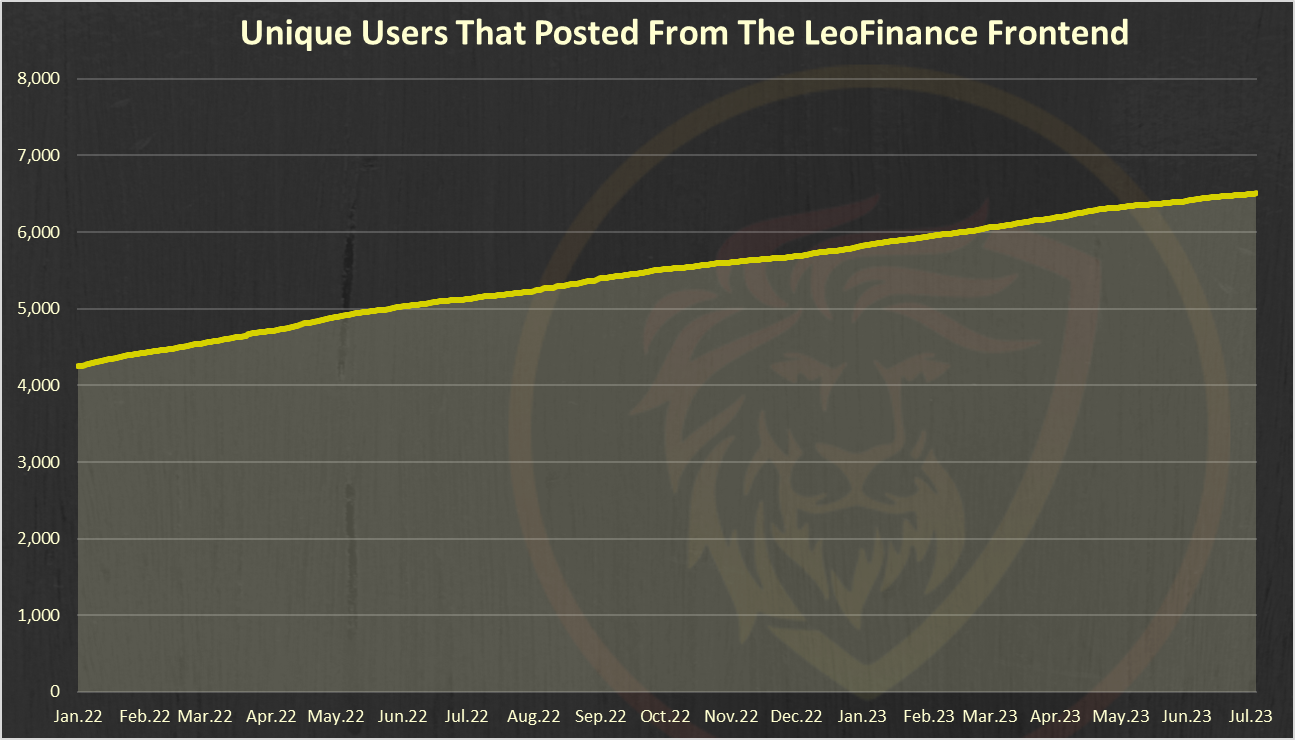
A 6.6k unique accounts have posted from the LeoFinance.
Monthly Active Users Posting and Commenting from LeoFInance [MAU]
Here is the chart for the monthly active users combined from the legacy UI leofinance.io and the new threads UI.
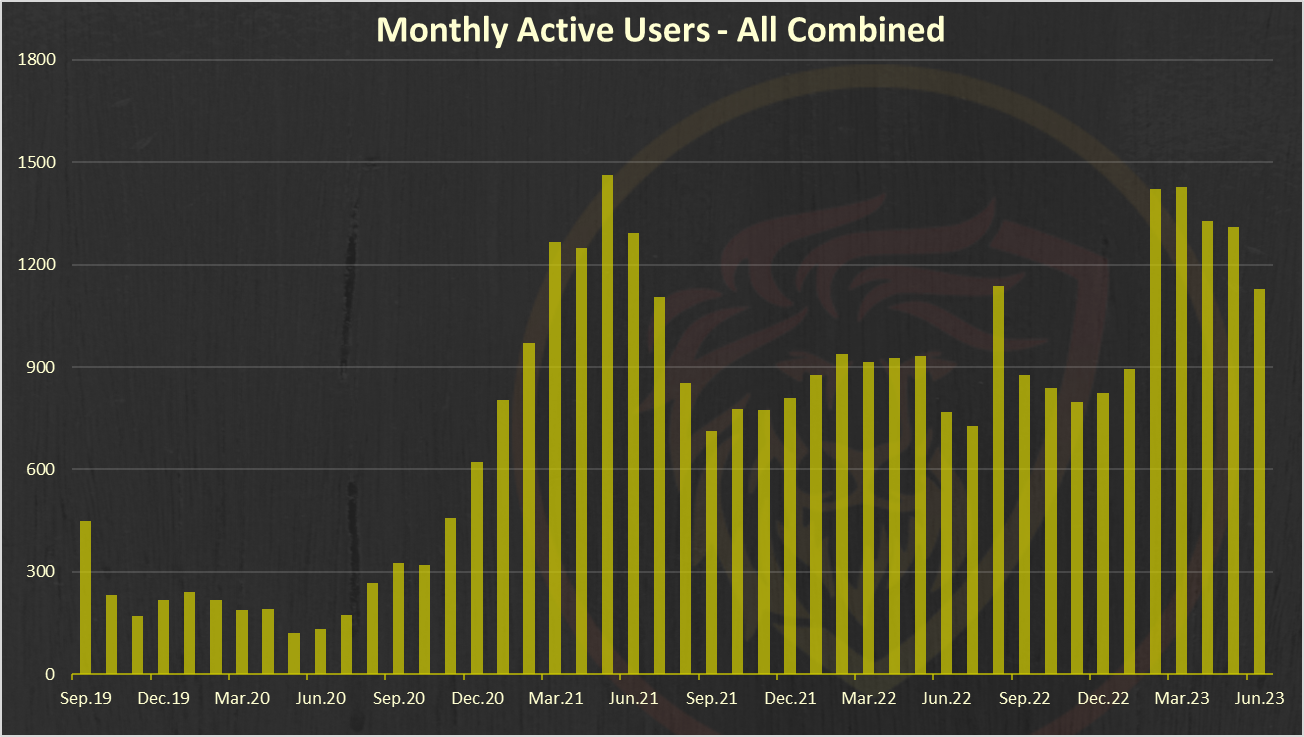
June has a small drop in the numbers of MAUs after the strong growth in the previous months.
Posts, Comments and Threads
Here is the chart.
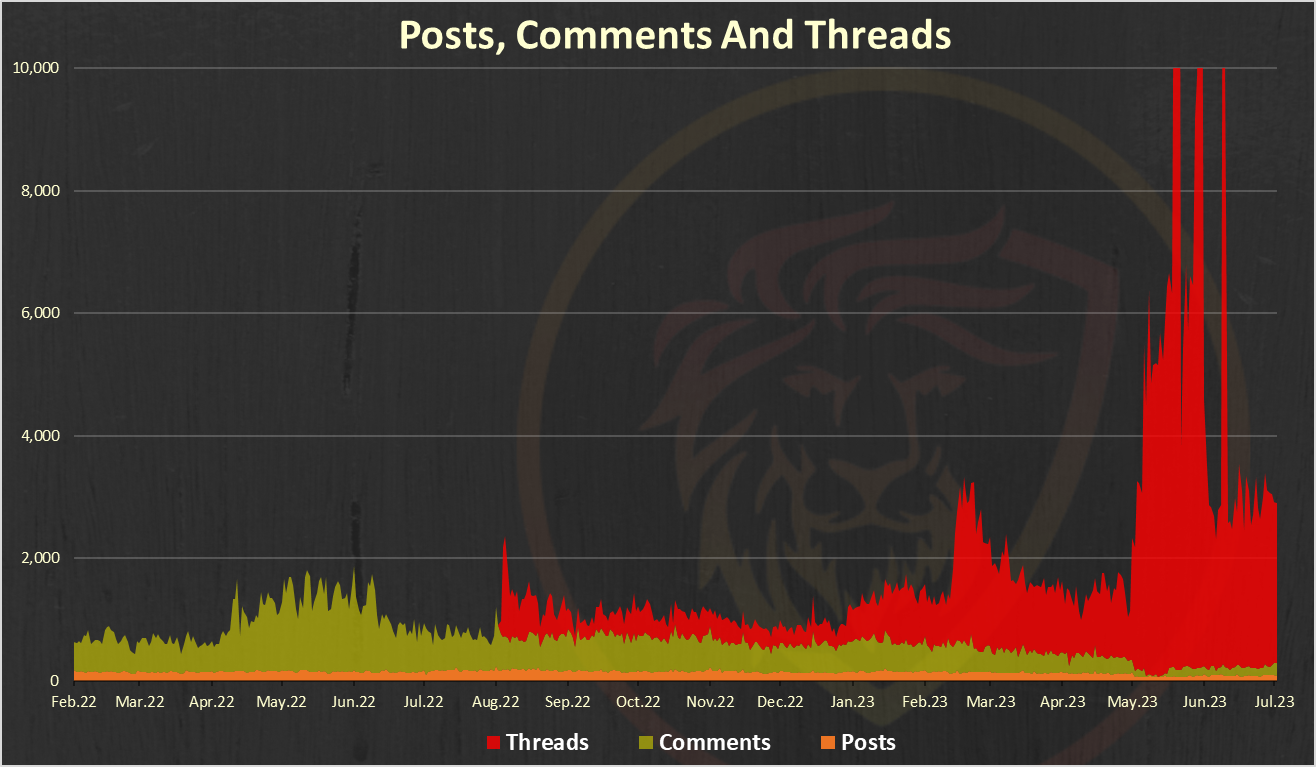
We can see the overall growth here that has happened in the last month. The numbers of daily threads have increased a lot in May. On occasions there were even 20k threads per day. In the recent days the average seems to be stabilizing around 3k threads per day.
Top Threads Creators
Here is the chart.
CHART
@taskmaster4450le is on the top here.
Price
Here is the price chart in dollar value with average price.
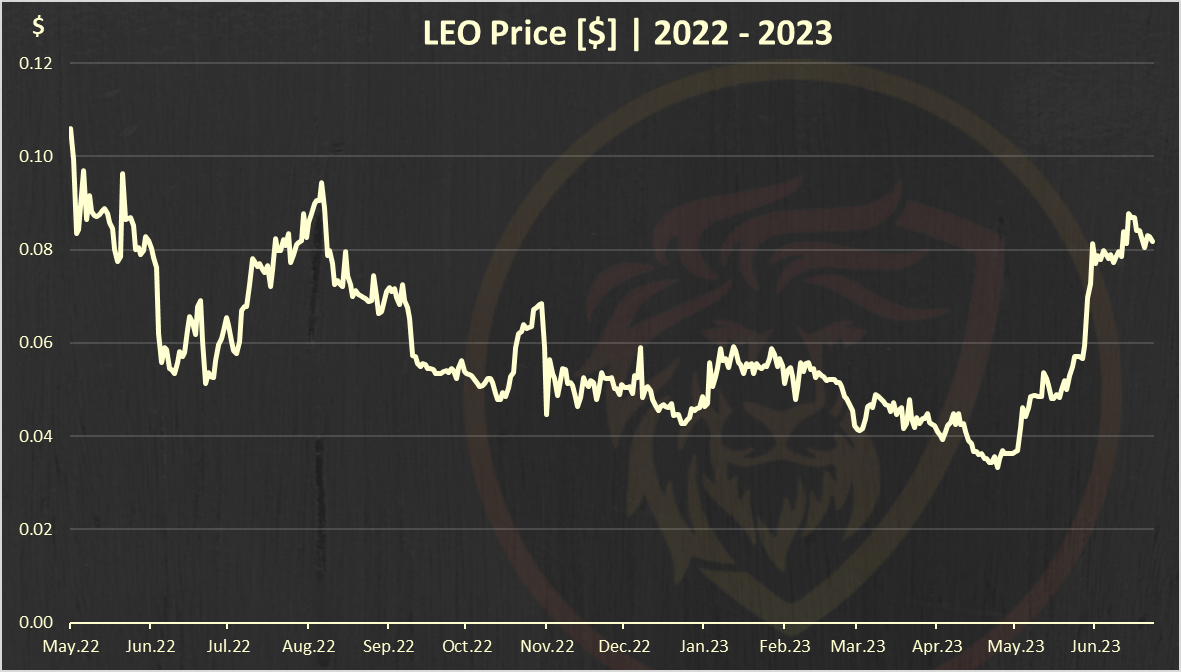
The LEO token has been appreciating in price, and after reaching 6 cents in a short period of time it has maintained that spot and has continued to increase slowly and now is at 8 cents.

Report by @dalz
Posted Using LeoFinance Alpha