Introducing Hive Portfolio Charter - Sister of Hive Portfolio Tracker
Or maybe it's a brother. Up to you!
It can easily be accessed from here, as a GitHub Page.
What it does is pretty straight-forward:
Loads a number of snapshots of a certain type (daily, weekly, etc.), and creates 3 charts for them, with the values in USD, HIVE, and BTC for the selected total or token/diesel pool.
As easy as it seems, and as quickly as a working prototype was ready, making it work for different edge cases was a different deal altogether (for example: different treatment if we have few data points or many). I even tried charts.js at first and then switched to D3.js.
As I was getting ready to write this post, I realized I show nowhere the name of the account for which the charts are for. That's not a big deal unless you want to create a screenshot to show to someone else. Otherwise, if you organize your snapshots well, knowing which ones you loaded won't be an issue. However, I will add that username in a future release.
The next two things that came to my mind were about defensive programming, which I wasn't doing in this case. If the user mixes up snapshots of different accounts or of different types this could create some issues. The second one shouldn't be an issue since their structure is the same, and the date is recorded in full. But mixing up snapshots of different accounts would create messy and worthless charts. So, I'll have to check on that in the future. Right now, for this initial version, I rely on the fact the user doesn't purposely want to break the app.
Enough talk! Let's look at some pretty charts, shall we? Looks like my portfolio is doing well for this account for the period selected. I haven't selected a longer period, because right before that I started tracking the L1 holdings and that, as you can imagine, squeezes the chart a bit.
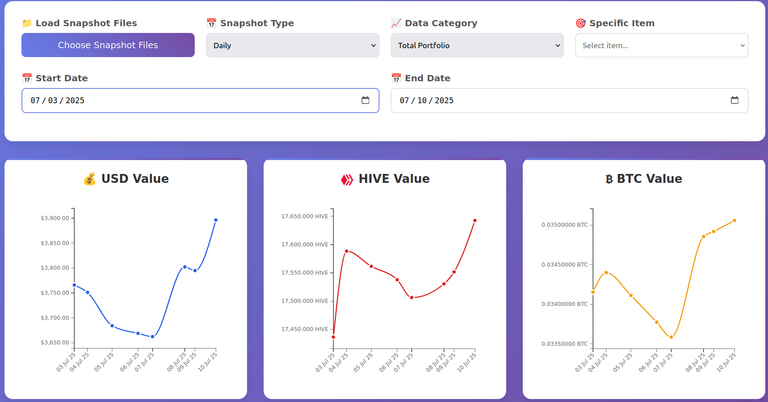
But I was curious why the 150 jump in HIVE from one day to the next, from 3rd to 4rd. That makes me think that I'll need to add the price of each "coin" (if we include USD in that category, lol, to make it easier to find a word) at every data point, in the tooltips.
Interesting how it looks the growth by only the Hive L1 tokens:
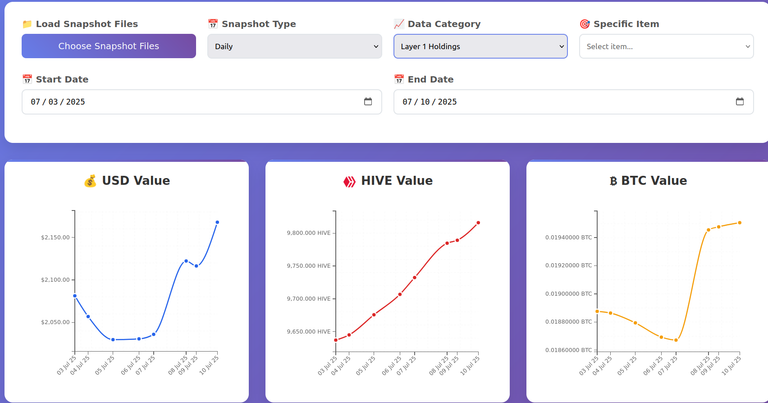
Look what happened with their USD and BTC value in the second part of the interval!😀
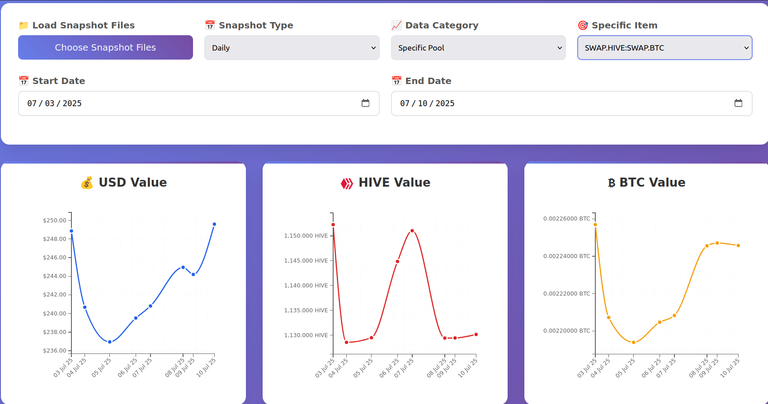
And here's how my SWAP.HIVE:SWAP.BTC diesel pool position evolved on the same interval:
And... surprise, surprise! My Hive-Engine tokens (on this account) seem to be doing well:
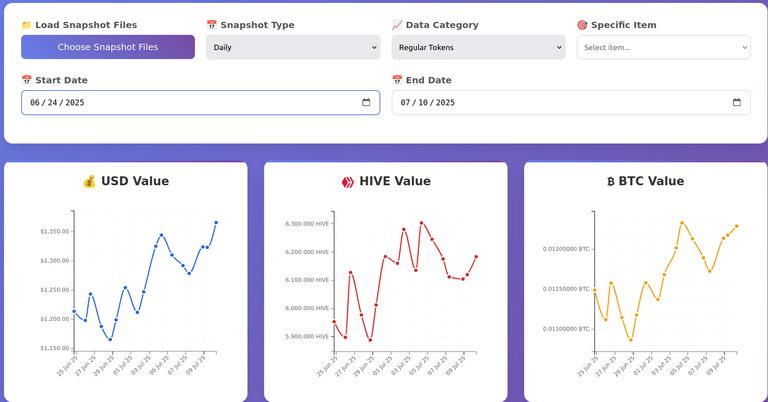
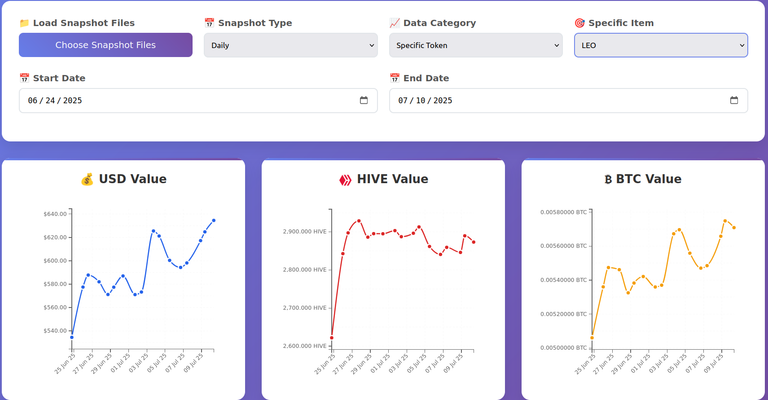
Nice evolution by LEO lately:
What Next?
Besides what I already mentioned here, I have more ideas about how this can become even more powerful. It would help if I could get unitary historical prices for... anything.😀 I mean, prices from a more distant past, when I wasn't tracking them. BTC historical prices won't be a problem. Maybe (I'm not sure), HIVE and HBD too. But HE tokens and diesel pool positions, that would likely be tough.
If you have some ideas of your own, let me know, and I'll see what I can do about it.
If you use the tool(s) and notice any discrepancies or potential bugs, also let me know. I practically only started to delve into analyzing chart data and see if they are off in any way.
Interested in Creating Your Own Snapshots?
To use Hive Portfolio Charter you need snapshots to load, which are structured as JSON files.
You can use snapshots created by Hive Portfolio Tracker, or you can create your own using another tool.
For the second case, I'll add the example structure of a snapshot JSON file below:
{
  "metadata": {
    "account": "username",
    "snapshot_timestamp": "2025-07-10 08:09:43",
    "snapshot_unix": 1752124183,
    "script_version": "1.61 (informative only, you can ignore this line)",
    "prices": {
      "hive_usd": 0.220848,
      "hbd_usd": 1.084,
      "btc_usd": 111139,
      "hive_btc_ratio": 503237
    },
    "snapshot_type": "daily",
    "filename": "2025-07-10.json"
  },
  "summary": {
    "total_portfolio": {
      "usd": 39.45123246254131,
      "hive": 178.635226321005,
      "btc": 0.0003549719941923295
    },
    "layer1_total": {
      "usd": 4.27431648401188,
      "hive": 19.354109994257954,
      "btc": 3.845919509813729e-05
    },
    "tokens_total": {
      "usd": 6.11387377937088,
      "hive": 27.68362756,
      "btc": 5.501105623922187e-05
    },
    "pools_total": {
      "usd": 29.063042199158552,
      "hive": 131.59748876674706,
      "btc": 0.0002615017428549704
    },
    "token_count": 1,
    "pool_count": 1,
    "layer1_assets": 4
  },
  "layer1_holdings": {
    "liquid_hive": {
      "amount": 19.353,
      "value_usd": 4.274071344,
      "value_hive": 19.353,
      "value_btc": 3.845698939166269e-05
    },
    "hive_power": {
      "owned": 0.0011099942579528785,
      "delegated_in": 0.0,
      "delegated_out": 0.0,
      "effective": 0.0011099942579528785,
      "value_usd": 0.0002451400118803773,
      "value_hive": 0.0011099942579528785,
      "value_btc": 2.2057064745982714e-09
    },
    "savings_hive": {
      "amount": 0.0,
      "value_usd": 0.0,
      "value_hive": 0.0,
      "value_btc": 0.0
    },
    "liquid_hbd": {
      "amount": 0.0,
      "value_usd": 0.0,
      "value_hive": 0.0,
      "value_btc": 0.0
    },
    "savings_hbd": {
      "amount": 0.0,
      "value_usd": 0.0,
      "value_hive": 0.0,
      "value_btc": 0.0
    },
    "totals": {
      "total_hive_amount": 19.354109994257954,
      "total_hbd_amount": 0.0,
      "total_value_usd": 4.27431648401188,
      "total_value_hive": 19.354109994257954,
      "total_value_btc": 3.845919509813729e-05
    }
  },
  "tokens": {
    "SWAP.HIVE": {
      "liquid": 27.68362756,
      "staked": 0.0,
      "delegated": 0.0,
      "total_amount": 27.68362756,
      "market": {
        "volume_24h_usd": 0.0
      },
      "values": {
        "usd": 6.11387377937088,
        "hive": 27.68362756,
        "btc": 5.501105623922187e-05
      }
    }
  },
  "diesel_pools": {
    "SWAP.HIVE:SWAP.BTC": {
      "pool_name": "SWAP.HIVE:SWAP.BTC",
      "shares": 0.14674544674178985,
      "share_percentage": 0.026104473011190413,
      "base_amount": 131.59748876674706,
      "quote_amount": 0.0002577834304269863,
      "values": {
        "usd": 29.063042199158552,
        "hive": 131.59748876674706,
        "btc": 0.0002615017428549704
      }
    }
  }
}
Now with the charts it's becoming way more self explaining... Beside value charts of balance increase/decrease could be nice
Good idea! I'll have it on my to do list for sure for future releases.
https://x.com/jewellery_all/status/1943406557645225995
#hive
Thanks for sharing!
https://x.com/lee19389/status/1943431349169266919
#hive #posh
It sounds nice, but I wonder about the HE part. I think there are some tokens that are kind of illiquid so I wonder how things would go in regards to that. If someone pumped the price, then the value could be overinflated. Then again, I am not sure
That is why you can look at individual tokens/diesel pools or ignore HE completely.
Also, the snapshot is for the HE tokens of your choice (normally, what you hold in your account in significant amounts), not for all HE tokens.
Update: But... I checked this morning. I need to fix some issues with the charts/data for HE. At first impression, if there are no transactions during a day, the price can go haywire. For example, for CARTEL it uses a transaction old of 22 days. Probably can't get any bid and ask info from hive-engine API for it. I wonder how the other tools are doing it... Like beeswap. Maybe they are reading the chain for custom jsons to see what orders are posted. Either way, if that's the way to do it, I'm not going that route (not that I couldn't, but it's not worth it). Whatever the API gives me access to, I'll use.
Really Very Helpfull Platform You Provide , Thanks a lot
You're welcome.