STEEM Liquidation Heatmap – Calm Before the Storm?
G’day crew,
Let’s crack open the STEEM chart and have a proper look at what’s been going on. While it might not have had the full fireworks display that HIVE just put on, there’s still plenty happening if you know where to look.
This liquidation heatmap is like a weather radar for the markets — and from the looks of it, there’s a storm building. Grab a cuppa, and let’s break it down.
First, A Quick Recap: What’s a Liquidation Heatmap Again?
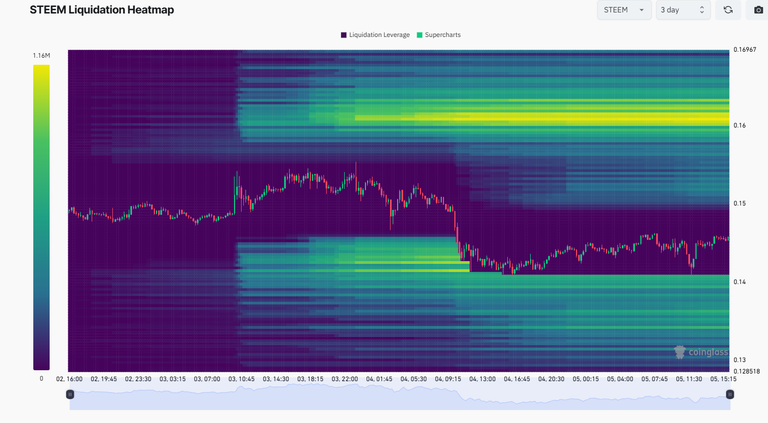
For anyone new to this: a liquidation heatmap shows where leveraged positions are stacked in the market. The bright colours? That’s where it’s spicy — big clusters of traders are about to get stopped out or liquidated if the price nudges too far in the wrong direction.
- Purple = Low activity (quiet zones)
- Green to Yellow = High activity (watch your back zones)
- Bright Yellow = Huge leverage sitting there, prime for pain
🔍 What the STEEM Heatmap is Telling Us
Over the last three days, STEEM’s been in a bit of a holding pattern, stuck in a channel roughly between $0.13 and $0.16. But don’t mistake that for safety — it’s the quiet ones you’ve got to watch.
1. The $0.16 Liquidation Minefield
One of the clearest things on this chart is the massive bright yellow band between $0.16 and $0.162. This is where the herd has gone long with high leverage.
- This is resistance city now.
- If the price rallies into this zone, it could trigger:
- Profit-taking from early buyers
- Forced buying from shorts
- Followed by a potential rug pull, liquidating longs
It's a textbook bull trap waiting to spring.
2. The Middle Band: Trading Chop Between $0.14 and $0.15
This area’s been the battleground. A lot of sideways price action, not a heap of liquidations — but it’s where traders are entering and exiting positions in uncertainty.
- No major clusters in here, but keep an eye on it.
- If price stalls in this range, it may build up more heat over time.
This is where the market's indecision is playing out right now.
3. Building Risk Zones Underneath: $0.13 and Below
As the price slipped from above $0.15, traders started layering in fresh longs down around $0.13 — probably thinking they’re buying the dip.
- But if we head south again and crack that $0.13 mark?
- That’s when the trapdoor opens.
- These new longs become sitting ducks for liquidation.
- Could trigger a sharp wick down.
If the volume kicks up, this could be the next pain point.
Volume and Sentiment: Flat, but Watching the Fuse
Unlike HIVE, where you could feel the panic in the chart, STEEM’s volume has been relatively flat.
- That’s not always a good thing — it often precedes a big move.
- The market is coiling, and those liquidation clusters are building pressure like a kettle on the boil.
This isn’t the time to get complacent — it’s the time to watch for the breakout or breakdown.
What’s the Play Here?
Here’s the smart approach based on the heatmap:
- Don’t long blindly into $0.16 resistance — that area’s littered with leverage. High risk of rejection.
- If you’re long near $0.13-$0.14, keep a tight stop. If it breaks below $0.13, liquidations could cascade.
- Sit tight or scalp the range if you’re nimble. Otherwise, wait for confirmation before making a move.
The key is not to guess — use the heatmap to see where the crowd’s exposed. Then avoid standing in the same spot as everyone else.
Quick Compare with HIVE
| Aspect | STEEM | HIVE |
|---|---|---|
| Recent Price Action | Gradual decline, steady range | Sharp pump then dump |
| Heatmap Pressure | High at $0.16, growing at $0.13 | Intense above $0.30, building below $0.22 |
| Liquidation Clusters | Tight and focused | Broad and stacked at multiple levels |
| Trader Behaviour | Patient and cautious (so far) | Aggressive entries, rapid exits |
| Immediate Risk Zone | Below $0.13 | Below $0.22 |
| Likely Next Move | Breakout or flush coming soon | Already flushed, may bounce or bleed |
Final Word from the Aussie Chart Watcher
STEEM hasn’t blown up yet — but that might be the whole point. It’s sitting tight, pressure’s building, and a breakout (or breakdown) could be right around the corner.
The smart money watches what others ignore. And right now? The crowd's laying traps at $0.16 and $0.13. Don't be the one who springs them.
Be patient. Be sharp. Don’t be the kangaroo on the freeway.
Congratulations @failingforwards! You have completed the following achievement on the Hive blockchain And have been rewarded with New badge(s)
Your next target is to reach 165000 upvotes.
You can view your badges on your board and compare yourself to others in the Ranking
If you no longer want to receive notifications, reply to this comment with the word
STOPCheck out our last posts: