# HIVE Liquidation Heatmap – What the Bloody Hell's Going On?
G’day legends,
If you've had your eye on the HIVE chart lately, you might’ve noticed a bit of a rollercoaster. We’ve had a proper shake-up over the past three days, and the liquidation heatmap is lighting up like a pub on Friday arvo.
Let’s have a squiz at what it all means, and why it might matter to you — whether you’re hodling, trading, or just crypto-curious.
First up – What Even Is a Liquidation Heatmap?
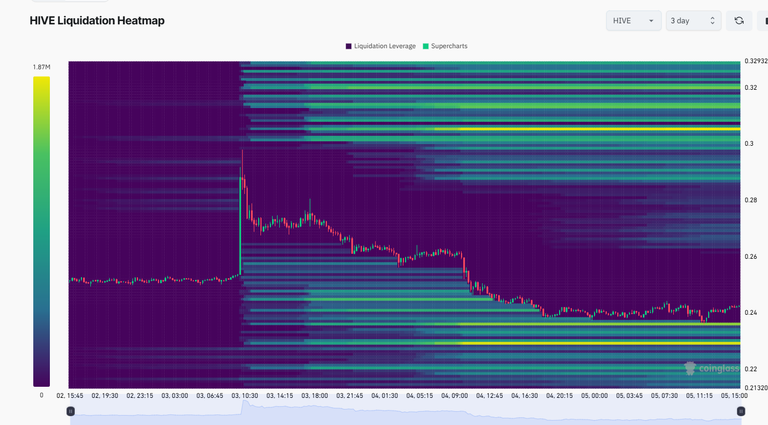
Good question. A liquidation heatmap shows where the leveraged traders are hiding — basically, where they’ll get liquidated if the price heads the wrong way. These are the battlegrounds where the market chews people up and spits them out.
- Purple bits – not much action, pretty chill.
- Green to Yellow bands – danger zone! That’s where people get wrecked.
So when you see a heap of yellow, that’s where you know a lot of traders could get forced out of their positions. Think of it like financial carnage waiting to happen.
What We’re Seeing on the HIVE Chart
May 3 – Spike’n’Dump Special
Right around the morning of May 3, the price spiked up fast — then carked it just as quick.
- Classic case of the ol' bait and switch — suck in some longs, make ’em feel good, then pull the rug.
- All those bright yellow zones got gobbled up as the price tanked. Liquidations galore.
Stacked Liquidations Around $0.30 – $0.32
See those neon bands up top? That’s a stack of long traders who loaded up heavy in that zone — and they paid the price.
- As HIVE dropped below $0.30, many got wiped out.
- That zone now acts like solid resistance — the market remembers the pain.
New Danger Zones Down Low ($0.21 – $0.23)
Now that we’re floating around $0.24, we can see a whole new set of bright zones popping up under us.
- People are piling into fresh longs again, hoping for a bounce.
- But if the price dips, it could trigger another wave of liquidations. Not ideal.
What You Can Learn from All This
Here’s the no-nonsense version:
- Liquidation bands = magnets for price. Markets love wiping folks out.
- Above $0.30 = trap zone. Heavy resistance.
- Below $0.23 = potential liquidation cliff if we drop further.
- If you’re in the market, tighten your stop-loss or grab the popcorn.
Final Word – Don’t Be a Muppet
Look, trading crypto’s no walk in the park — especially when leverage is involved. This heatmap is a bloody useful tool for spotting where the crowd is exposed.
In crypto, the crowd usually cops it.
So keep your head on, manage your risk, and remember: just ’cause it's lighting up doesn’t mean you have to jump in.
Cheers and stay safe out there,
Many people get reckless jump in and get dumped on 😂👍🏾 @tipu curate
Upvoted 👌 (Mana: 2/52) Liquid rewards.
Agree ! I have been slughtered a few times myself
If you like a coin the best thing to do is DCA and staking is also good I love making passive income and there is just so many opportunities out there 😉
The price of Hive is manipulated hard 😂😂😂