$HIVE, $BTC & ETH/BTC Technical Analysis - 01.02.2026
It's the 1st of the month today, an important day as we have the monthly close, so let's see what we got so far and what we can do next week.

We closed last month with a bearish candle unfortunately. The overall drop in the market we had this week didn't spare $HIVE either, so we closed the month with a bearish candle.
So far price is above the monthly open, but it's way, way, way too soon to conclude anything as not even a day has passed of the new month. levels of interest are marked on the chart and previous analysis regarding levels is still valid.

On the weekly chart, price has swept liquidity from $0.0835, which was the swing low, bounced and it it trading slightly above it. Levels to watch on the upside, if we get a reversal at some point and some momentum are $0.113 and $0.1214. In case the weakness continues, the lext liquidity level on the downside is all time low (ATL) at $0.0327, unfortunately.

On the daily time frame, price swept liquidity, from the previous swing low at $0.0835 yesterday. Today we can see a bounce, price attempted to sweep internal liquidity from the bearish gap and invert it, but got rejected. If the current candle closes above $0.075, this level will be confirmed as the current swing low and would mean external liquidity level, but for that, we need to wait till the current candle close.
For bullish continuation, price needs to invert the bearish gap between $0.0882 and $0.0925, after which the levels I'd be keeping an eye on are $0.0967 and $0.0987. Above that we have the two bearish gaps, that mean resistance.

On the h4 time frame, we have quite an ugly rejection today. Yesterdays drop left a bearish gap in the way down, which was rebalanced today, but there was not enough buying pressure to keep price at that level, or close above the gap, so at the time of writing, price is below the gap again. If there's more weakness in the market, sweeping the current swing low at $0.075 is in the cards.
For bullish continuation, price needs to get back above the bearish gap, marked with yellow on my chart, invert it and hold. The immediate level to watch on the upside is $0.0898, after which comes the other bearish gap, that needs to be inverted.

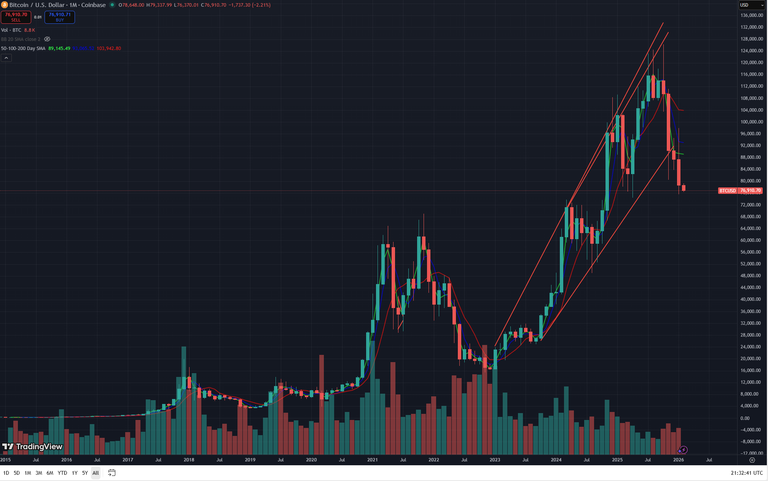
$BTC hit the bearish gap between $97777 and $97931 on the 14th of February and got rejected. Yesterday price swept liquidity from $80607 and could not bounce off that level. At the time of writing, chances for price to sweep $74456 are high. I'm expecting a bounce at that level and some sideways price action, but it remains to be seen as TA is not about what I'm expecting. We deal with what the chart gives us.

ETH/BTC is at a crucial level. This level has to hold and we need a bounce here, otherwise things can get ugly.

Next week we have a full economic calendar, there's news to drop every day, so get ready for some volatility.

Remember, technical analysis is not about forecasting price, but about reacting to what price does.
As always, this is a game of probabilities, not certainties. Also please note, this is not financial advice, it's my view and understanding of the market.
All charts posted here are screenshots from Tradinview.
Come trade with me on Bybit.
If you're a newbie, you may want to check out these guides:
- Communities Explained - Newbie Guide
- Cross Posting And Reposting Explained, Using PeakD
- Hive Is Not For Me
- How To Pump Your Reputation Fast - Newbie Guide
- Tips And Tricks & Useful Hive Tools For Newbies
- More Useful Tools On Hive - Newbie Guide
- Community List And Why It Is Important To Post In The Right Community
- Witnesses And Proposals Explained - Newbie Guide
- To Stake, Or Not To Stake - Newbie Guide
- Tags And Tagging - Newbie Guide
- Newbie Expectations And Reality
- About Dust Vote And Hive Reward Pool, by libertycrypto27

Thank you for the unbiased breakdown of the technicals, I appreciate the data.
I'm not well versed in crypto at all (I'm here for the community and stories) so I won't pretend to know what I'm talking about, but I read a lot of chatter about a 4 year cycle that ended recently and started this bearish trend that will continue until October-ish. From a purely technical perspective, do you find any credence in that theory?
The 4 year cycles, as we used to know them are over in my opinion.
I wouldn't give any credibility to chatter like that as no one knows what's going to happen. The market participants are very different now, we have institutional participants, not just retail, adoption is ongoing on a much larger scale, so everything is different now.
From purely technical perspective, we trade what the chart gives us, we trade level to level on both directions and nothing else matters. I personally don't like to focus on cycles as for me the only thing that matters is the current price action and I'm relying totally on charts.
It seems that the current price action for BTC indicates a potential drop to the 52-60K area due to a break down in the long term trend:
Congratulations @erikah! You received a personal badge!
Participate in the next Power Up Day and try to power-up more HIVE to get a bigger Power-Bee.
May the Hive Power be with you!
You can view your badges on your board and compare yourself to others in the Ranking
Check out our last posts: