$HIVE & $BTC Technical Analysis - 25.05.2025
It's Sunday, so let's have our weekly $HIVE & $BTC technical analysis, to see where these assets are at the moment and see what are the levels to pay attention to.
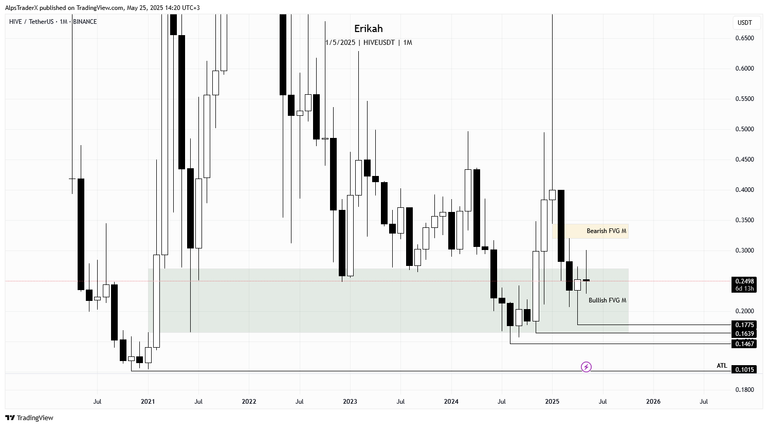
The month is ending next week and the monthly candle is a doji at the moment of writing, which means indecision. Last week, this candle, although not closed, looked bullish but we had a slight drop since then. Let's see what the candle will look like on Saturday, after closing.
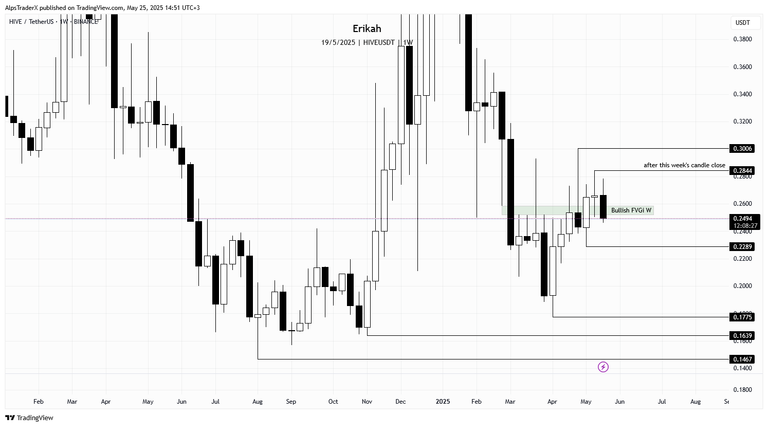
The weekly price action is quite disappointing to be honest, but again, emotions have no place in this game. Last week's candle managed to close above the inverted gap, that should have defended price, but this week, so far, we have a bearish engulfing candle and there are chances for this candle to close below the gap. There are 12 hours till the candle close, so we can't take anything for granted yet.
In case of more weakness, I'm looking at $0.2289 as the next liquidity pool on the downside and $0.1775, in case price does not bounce there.
In case price shows some strength, the next liquidity pool is at $0.2844, a swing high that is not confirmed yet, till this week's candle is not closed.
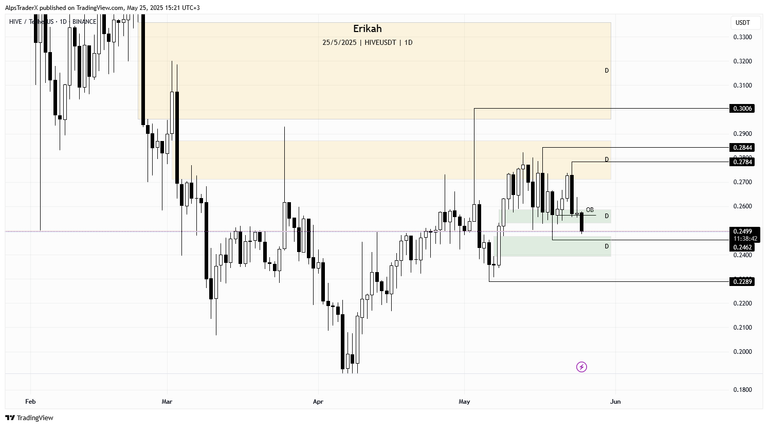
The daily chart shows more clarity. At the time of writing, price is below the bullish gap, that should have defended price. In case this candle closes below $0.2564, that would set the bearish order block and confirm a change in state of delivery. There are 11 hours till the candle close, but chances for that to happen are high. The next level I'm watching on the downside to be swept is $0.2462, which would mean a retest of the bullish gap as well. That second gap between $0.2393 and $0.2477 should defend price, but if it fails, we can witness a sweep of the swing low at v$0.2289.
In case we get a bounce, the levels I'm looking at on the upside is $0.2784, $0.2844 and $0.3006.
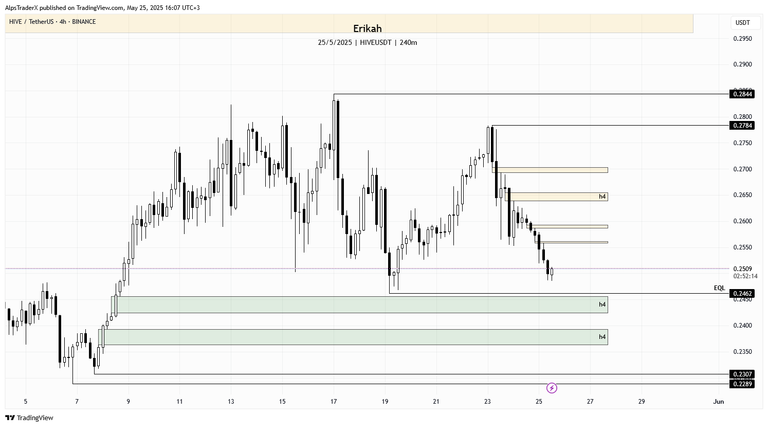
On a more granular scale, on the h4 chart price is nearing the equal lows at $0.2462, which is going to be swept soon as it looks. That is an important level as we have a bullish gap there, so sweeping $0.2462 and tapping into the gap looks very likely at this point. If that level can't hold price, there's another gap that should defend price, lower. Ultimately, in case price shows weakness, sweeping $0.2307 and $0.2289 is possible.
The sell side of the curve has a few gaps, marked with yellow, but none of them are huge, so if we get a bounce from the $0.2462 area, I'd hold my trade till $0.2784.
Today it's Sunday, no news catalyst planned for today, so most likely we won't see volatility, but tomorrow is Monday, traditional markets open, which can move price significantly.
Looks like next week is going to be a quiet one as far as the economic calendar is concerned. We only have 3 red folder days, but that doesn't mean there will not be volatility.
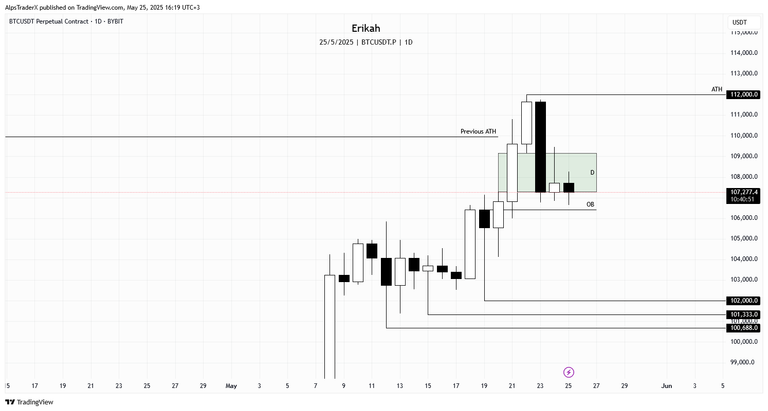
Interesting situation with $BTC.
This week we got a new ATH. On a daily chart, price is is at the bottom of the bullish gap. I'm not even sure if I should still take this gap into consideration, as it was rebalanced already on Friday, when price closed slightly below it. Then we got a bullish candle yesterday and today so far we have a bearish gap, which closes in roughly 10 hours.
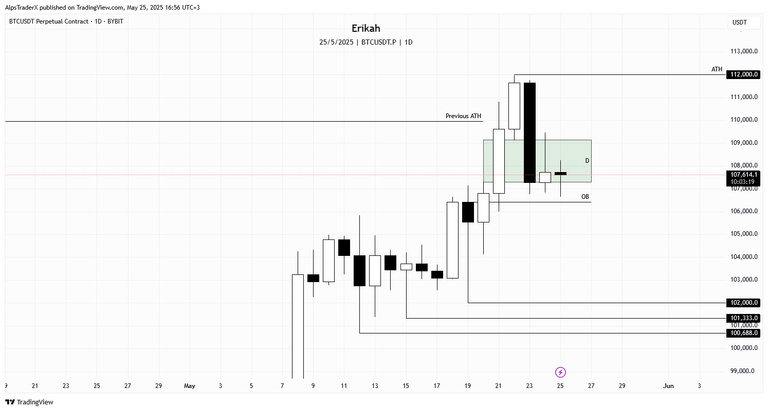
Got called away from my desk and in the meantime price made a slight move to the upside, it is not at the bottom of the gap anymore. Anyway, what we can expect next in case of weakness is for price to retest the order block (OB) at $106,428 and possibly bounce from there. In case of more weakness, $102,000 could be next, or the levels below, like $101,333 and $100,686.
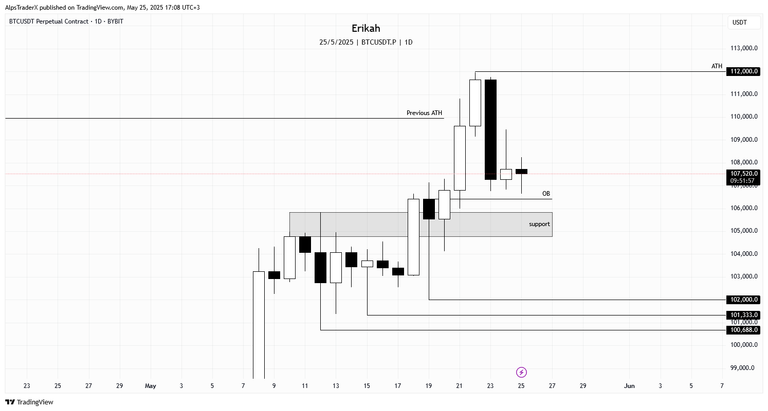
I'm not a support and resistance trader, I'm a liquidity hunter, but if I were to mark support, the grey box would be that and should hold.
In case of bullish continuation, price needs to close above $109,150, in which case the current ATH is next, at $112,000.
Remember, technical analysis is not about forecasting price, but about reacting to what price does.
As always, this is a game of probabilities, not certainties. Also please note, this is not financial advice, it's my view and understanding of the market.
All charts posted here are screenshots from Tradinview.
Come trade with me on Bybit.

If you're a newbie, you may want to check out these guides:
- Communities Explained - Newbie Guide
- Cross Posting And Reposting Explained, Using PeakD
- Hive Is Not For Me
- How To Pump Your Reputation Fast - Newbie Guide
- Tips And Tricks & Useful Hive Tools For Newbies
- More Useful Tools On Hive - Newbie Guide
- Community List And Why It Is Important To Post In The Right Community
- Witnesses And Proposals Explained - Newbie Guide
- To Stake, Or Not To Stake - Newbie Guide
- Tags And Tagging - Newbie Guide
- Newbie Expectations And Reality
- About Dust Vote And Hive Reward Pool, by libertycrypto27

!discovery 30
😀👍📊📈
Thank you @jlinaresp 😊
This post was shared and voted inside the discord by the curators team of discovery-it
Join our Community and follow our Curation Trail
Discovery-it is also a Witness, vote for us here
Delegate to us for passive income. Check our 80% fee-back Program
in the past few days I have also been monitoring the hive's movements. hopefully the next few days will be better.
Time will tell.
I love doji. Though I didn't expect to buy at the exact low, I already bought a small position and am waiting for a rally.
!PIZZA
I don't like dojo as it indicates indecision.
You made the right decision. Hunting perfect tops and bottoms can leave you empty handed.
Indecision after selling pressure is safer for me than trying to ride a rushing train.
Trying to ride a rushing train is suicide.
Many traders do that and then complain about why they lost their capital.
That is very true, but you know how it is, the market will humble them sooner or later. After getting rekt several times, they will learn.
$PIZZA slices delivered:
@rzc24-nftbbg(4/10) tipped @erikah
Come get MOONed!
Excellent as usual ! You have no idea how helpful your posts are for me. thank you very much ! I wish you an awesome week
I'm really glad to know it helps and I'm not just writing it for myself 😀
However, I'm aware that mist people here have no clue what I'm talking about.
You too, have a nice evening.
Thanks for the weekly Erica TA report 🙏 🙏
You're most welcome Steven!
Good morning Erikah, I am going to stick with the idea that at least it will move above the wick left by that candle that touched 0.30.
Just to visualise, you know... hahaha.... very good analysis! I always read them, I want you to know that.
Good afternoon @nanixxx. It will move above $0.3 for sure, sooner or later. The question is when 😜
Thank you for the nice comment and I'm glad to know you read them 🤗
we need a comfortable cushion... and when it starts to happen, we need to take a nerve calming medicine. 😄
Price bounced off the $0.2462 level. Slightly touched the bullish gap and shot through the first bearish gap.