$HIVE & $BTC Technical Analysis - 04.05.2025
It's Sunday again ladies and gents, so let's see what we're dealing with today. Let's do a brief $HIVE and $BTC market analysis and see what we can expect next week.
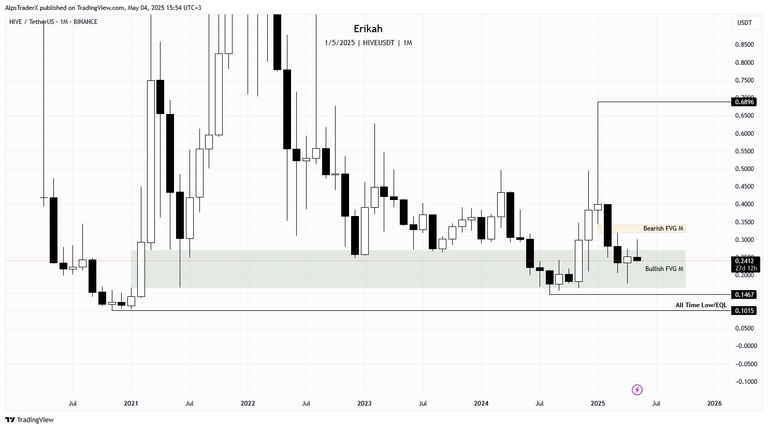
On the monthly time frame, this week we got the monthly candle close. It is a bullish candle with a long downside wick, which says that buyers stepped in and pushed price higher. There's not much to say about this month's candle, as there has been only 3 days so far.
Price is still inside the bullish gap, that has been holding price for 48 months now.
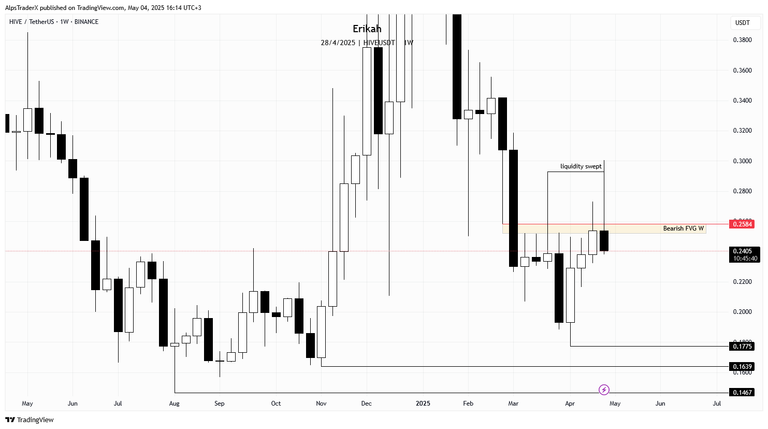
The weekly chart looks ... frustrating 😆. Can I say frustrating? Nope, I can't as emotions have no place in this game, so let's see why I said frustrating, apart from joking.
Last week price had an attempt to invert that bearish gap, marked with yellow on the chart, but could not close above it. This week we saw price sweeping liquidity from $0.2929 level, which I mentioned in my last post, but could not close above $0.2584. That bl**dy gap is capping the market for 7 weeks now and keeping price hostage as well. This week's candle is not closed, there are 10 hours till the candle close, but by the look of it, we won't get the close that would indicate bullish continuation.
In case price shows weakness, the next level on the downside I'm looking at is $0.1775, $0.1639 and ultimately $0.1467.
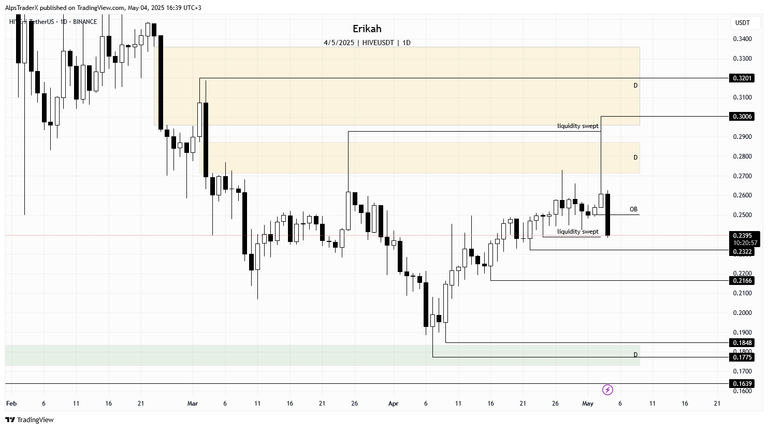
On the daily time frame, price swept liquidity from the $0.2929 level, got above the bearish gap that has been capping the market for 60 days, but could not hold. Yesterday's candle, although bullish, it has a long upside which which indicates selling pressure. Today's candle is a bearish one so far and if it closes like this, it's going to be a bearish engulfing candle and would confirm the bearish OB as well, which is drown on my chart, but it's not confirmed till the current candle closes.
If price continues to be heavy next week, we can witness the sweep of $0.2322, $0.2166 or lower. The truth is, the buy side (the leg up to where we are now) is really balanced, there's not much to stop price.
In case price bounces here, the next liquidity pool I'd keep my eyes on is at $0.3006, but in general, for bullish continuation, price needs to close above the bearish gaps.
The current price action looks like an accumulation period, but at some point we need to invert those gaps and continue to the upside.
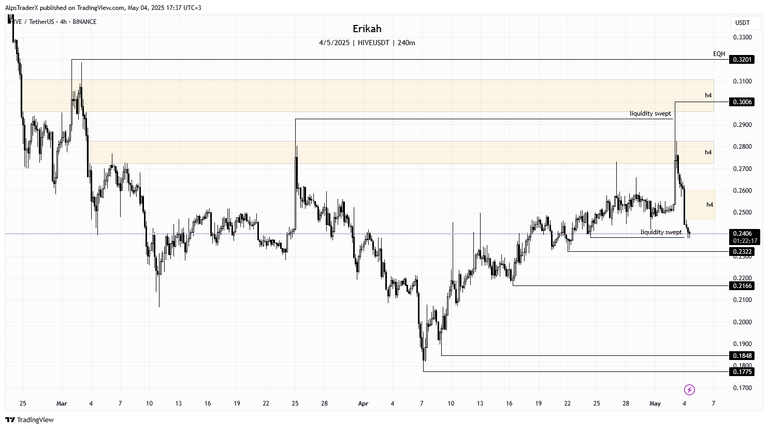
On the h4 time frame, yesterday price reached both bearish gaps yesterday, but there was not enough buying pressure to hold price at that level and price retraced. At the time of writing, price swept liquidity from the $0.2387 level and left a bearish gap on its way there, which means internal liquidity.
In case of more weakness, I'm looking at $0.2322 or even $0.2166 to be wept. For bullish continuation, price needs to close above $0.2609, invert the bearish gap and hold. This is valid for the next two bearish gaps on the upside, marked with yellow.
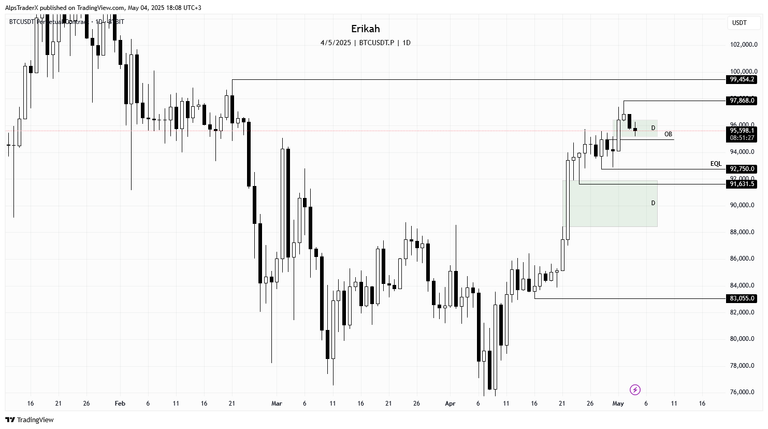
Since last week, $BTC managed to invert the gap that has been capping the market since March I believe and at the time of writing, price is retesting and rebalancing another gap, that was created on Thursday.
I'm expecting price to rebalance the bullish gap price is currently in, maybe engage with the bullish order block (OB), which should hold price. In case of weakness, we have relative equal lows at $92,750, which could be swept, or even revisit $91,631 and go deeper, to rebalance the bullish gap, marked with green.
For bullish continuation, this bullish gap price is in now, needs to defend price, in which case the next liquidity pool is at the swing high, at $97,868, then $99,454.
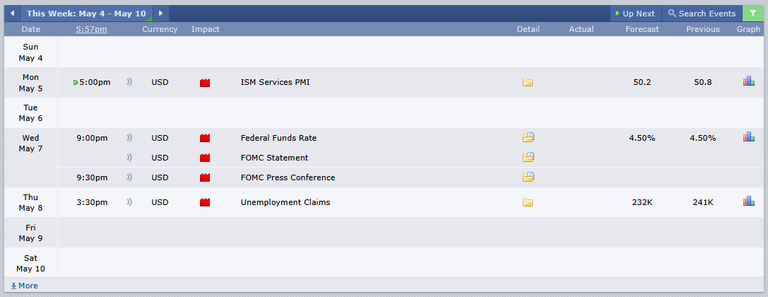
As far as economic news are concerned, next week we have 3 red folder days and FOMC, which can move the market both ways. I'd be cautious because in case of weakness, it's going to drag the whole market down.
Remember, technical analysis is not about forecasting price, but about reacting to what price does.
As always, this is a game of probabilities, not certainties. Also please note, this is not financial advice, it's my view and understanding of the market.
All charts posted here are screenshots from Tradinview.
Come trade with me on Bybit.

If you're a newbie, you may want to check out these guides:
- Communities Explained - Newbie Guide
- Cross Posting And Reposting Explained, Using PeakD
- Hive Is Not For Me
- How To Pump Your Reputation Fast - Newbie Guide
- Tips And Tricks & Useful Hive Tools For Newbies
- More Useful Tools On Hive - Newbie Guide
- Community List And Why It Is Important To Post In The Right Community
- Witnesses And Proposals Explained - Newbie Guide
- To Stake, Or Not To Stake - Newbie Guide
- Tags And Tagging - Newbie Guide
- Newbie Expectations And Reality
- About Dust Vote And Hive Reward Pool, by libertycrypto27

seems hive i still crawling, hope it looks good soon
Patience to see which way things go and just accumulate whatever crypto you can I guess is the best answer for now. I look forward to your weekly chart post as it is spot on.
Accumulating is the answer for sure, if you're thinking long term.
Stay tuned for the next episode 😉
One of my favorite childhood books - "The Little Engine that Could". Hive seems to be "the little token that couldn't" lately 🙁
HIVE and so many other tokens in the market, but no worries, our time will come.