Number of Transactions on Hive | Posts, Comments, Votes, Transfers, and Custom JSONs | Sep 2023
Hive is known for free transactions!
With the last Hardfork in October 2022, RCs were separated from HP, and this enabled even better management of the resource credits system and the feeless transactions.
In the past years games and especially Splinterlands have taken advantage of this and increased their product and users.
How are things these days?
Usually when talking about activity on the Hive blockchain a lot of the users have in mind posting and commenting. Here we will be looking in the top activities on the blockchain:
- Posts and Comments
- Votes
- Transfers
- Custom JSON operations
The above consists of the majority of all the transactions on the blockchain.
Number of Posts and Comments
Although gaming is growing on the blockchain, blogging still remains the core activity and one of the key method inflations is distributed. Users can blog about gaming as well 😊.
Here is the chart for the number of posts and comments on the Hive blockchain.
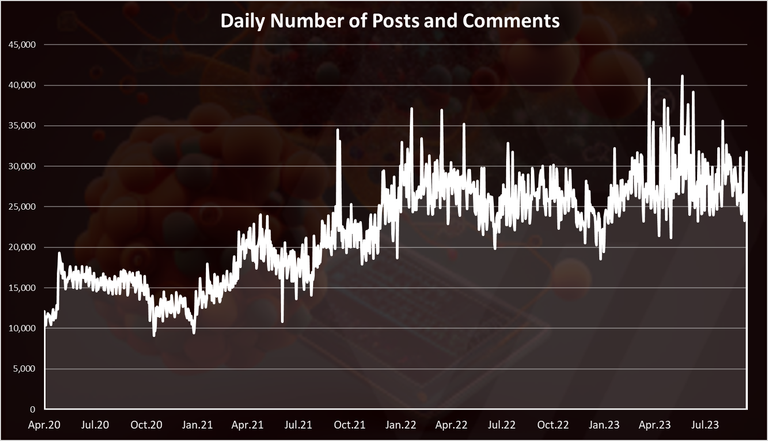
Starting from 2020 till today, we can see an overall uptrend in the number of posts and comments, when we look at them together. There was a peak back in January 2022, and a small decline throughout 2022, but in 2023 we have an increase again. It’s quite different from the overall price action.
Note that this increase is mostly driven by the Leothreads, where there are a lot of comments now. If we look at the numbers of posts only, we can notice a slight decrease there.
In the last period on average there are around 30k posts and comments per day, out of which 3k are posts and 27k comments.
Number of Votes
The chart for the votes looks like this.
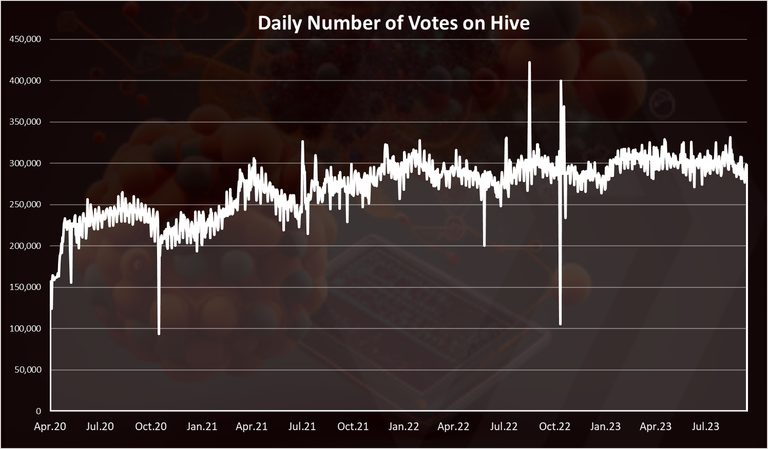
Votes are one of the core operations on the Hive blockchain. That is how the rewards are distributed. The Proof of Brain mechanism (PoB).
The number of votes has been quite steady in the period, compared to the price volatility.
We can notice a slight growth in the period with more than 300k votes per day now.
Number of Transfers
The chart for the transactions looks like this.
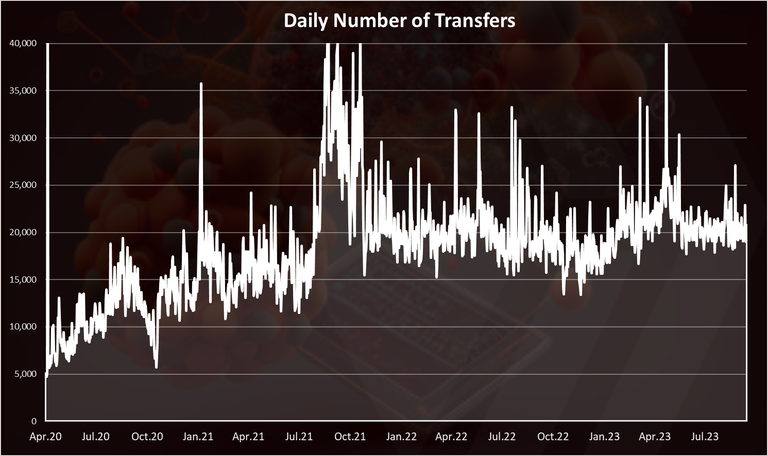
An overall uptrend when we zoom out. There is a spike back in August-September 2021, when there was a market volatility.
In the last period there is around 22k transfers maid daily.
Number of Custom JSONs operations
The chart for custom JSONs operations.
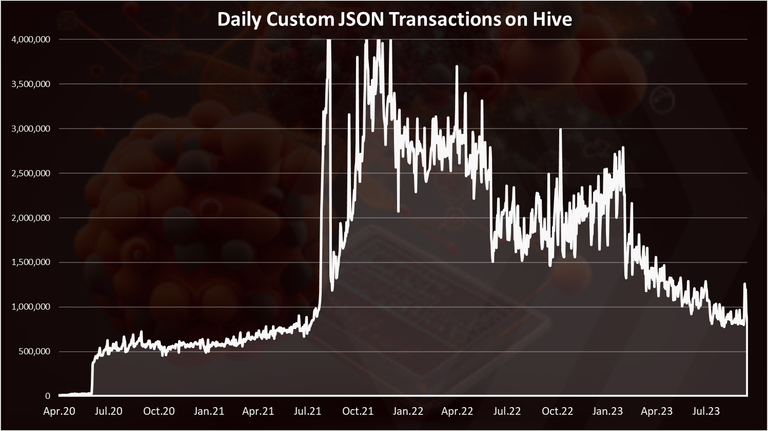
This is the number one type of operation on the blockchain at the moment.
This is the most volatile chart of all the types of operations on Hive. It mostly follows the Splinterlands development and activities. The ATH for custom jsons was back in the end of 2022, when on occasions there was 5M transactions per day. In the last period the number of custom jsons operations is around 1M daily.
Monthly Number of Transactions Per Category
The monthly chart presents a better overview of the transactions. Here it is.
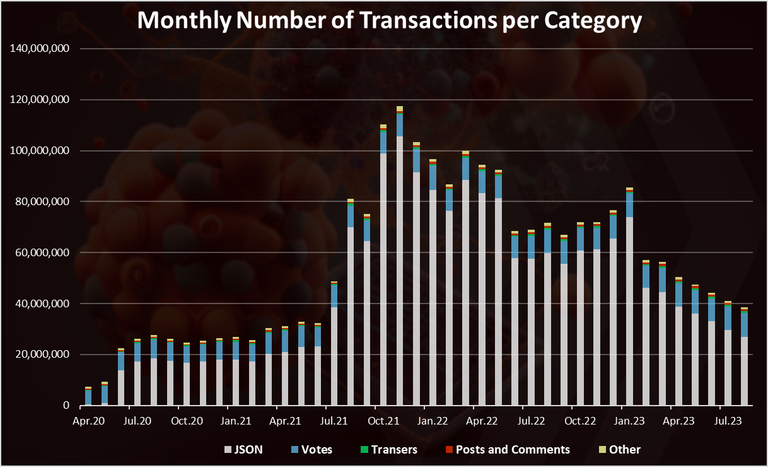
We can see that the custom json operations are dominating the chart and are defining the trend.
The ATH was back in November 2021, with more than 100M operations. In the last month there is around 40M transactions on the Hive blockchain, or around 1.3M per day. The overall number of transactions is down mostly because of Splinterlands. The other transactions, posts, comments, votes, transfers are either stable or slightly up.
Monthly Number of Posts and Comments
When we take a look only at the posts and comments per month, we get this:
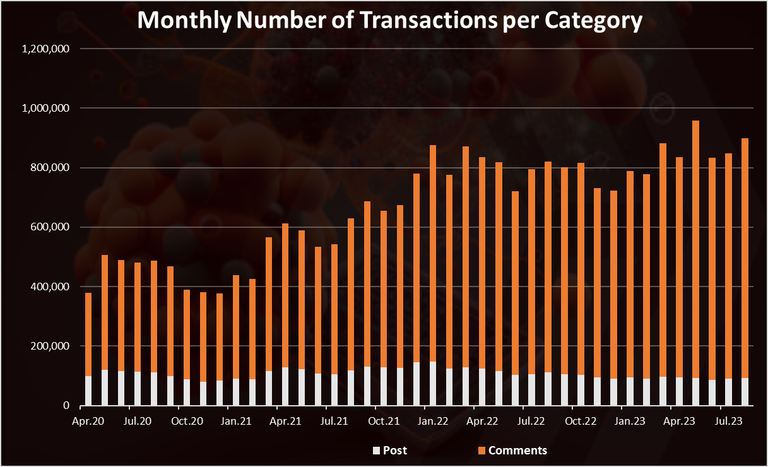
We can notice that cumulative data for posts and comments is up in the period 2020-2023. But when we look a bit closer, we can notice that the number of posts has been slightly varying, with top back in 2021 when the prices were high, while the number of comments has been continuously growing with some drops in between. The ATH for monthly comments was back in May 2023 with 864k comments made in the month.
Top Transactions in the Last 30 Days
Here is the chart for the transactions per category.
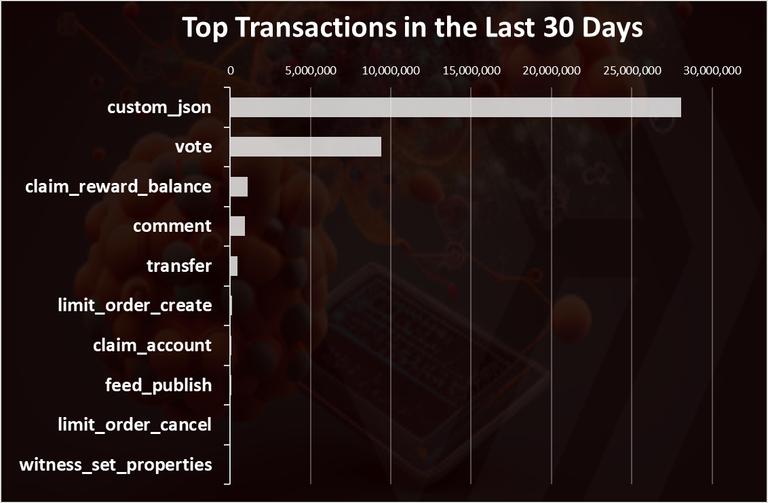
Not surprising, the custom jsons comes on the top with more than 28M transactions in the last 30 days. Next are votes with 1.1M, and interestingly enough the claim reward button on the third place.
Posts and comments are next followed by the transfers operations.
Another interesting operations from the list above is the limit orders that are made on the internal DEX. This is as a result of more liquid internal DEX and more trading operations made there, basically using the Hive chain as an exchange. Another of the many functionalities.
The pie chart looks like this:
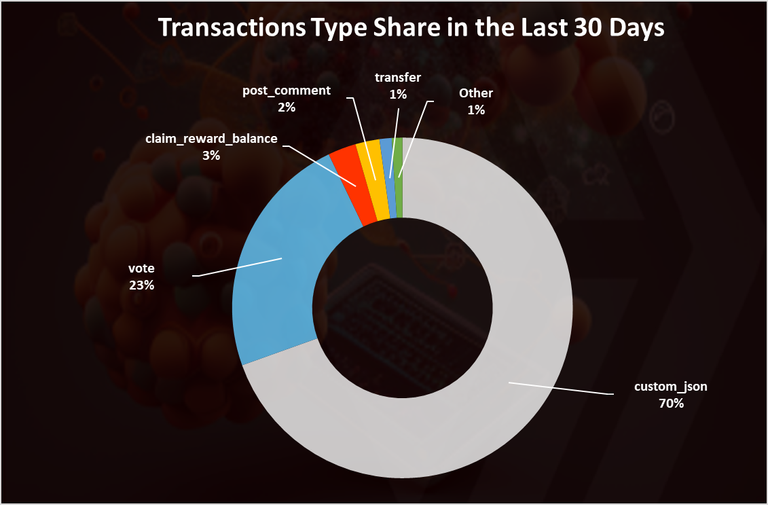
Here once again we can see the dominance of the custom json transactions. A 70% of all the transactions on chain in the last 30 days belong to this category.
The vote operation has a 23% share. The posts and comments are with around 2% share. While the share of custom jsons operations is still high, it has been going down in the last year.
Also, we should bear in mind that not all the transactions above have the same weight. Publishing a post usually requires more effort than just clicking an in-game button or clicking the like button.
Summury
Around 1.3M transactions per day now on the chain, down from 3M in 2022. Mostly because of the lower activity in Splinterlands. On a monthly level this number has been around 40M.
It’s interesting to note that the posting, commenting, votes and transfers all have a small growth in the number of transactions on chain in 2023. Apart from them the custom json operations are down, causing the overall operations to go down as well. Even with the drop the custom json operations still consist of the majority of the transactions with 70% share.
All the best
@dalz
Interesting stats.. Some people stop posting when the hive price is low but this should not be the case. Thanks for sharing.
I noticed this, that during this fall, in fact the values rise and fall, the posts from the Brazilian community (they are the ones I tend to curate most) continued with an excellent frequency, even on weekends that naturally decrease.
This time it was different, the continuity and number of posts remained at a high level and this is wonderful in my opinion, it shows that the level of trust is stable even in turbocharges.
encouraging figures
Number of Posts and Comments > Great data, from the graph it is evident that even in the hive's value turbolence, people continued posting, I felt that this time it was really different, with many posts despite the doubts.
The level of trust in Hive is high and that's all we need, people who believe in Hive.
Thanks for sharing all this it is a privilege to know about the analysis.
People love to play games because it is a great way to spend their time, so most of the people are doing it here, which is why this thing is coming to a top. Thanks for sharing this great analysis with us.
Thank you for sharing this great analysis I must confess
Everything looks great in these charts ;) Happy to see activity is growing on hive blockchain.