Number Of Transactions On Hive | Posts, Comments, Votes, Transfers, and Custom JSONs | May 2023
Hive is know for the free transactions! With the Hardfork 27 in October 2022, RCs were separated from HP, and this enabled even better management of the resource credits system and the feeless transactions.
In the past years games and especially Splinterlands have taken advantage of this and grew their product and users.
How are things these days? Is gaming still on the top.

Usually when talked about activity on the Hive blockchain a lot of the users have in mind posting and commenting. Here we will be looking in the top activities on the blockchain:
- Posts and Comments
- Votes
- Transfers
- Custom JSON operations
The above consist of the majority of all the transaction on the blockchain.
The period that we will be looking at here is 2022 - 2023.
Number of Posts and Comments
Although gaming is growing on the blockchain, blogging still remains the core activity and one of the key method inflations is distributed. Users can blog about gaming as well 😊.
Here is the chart for the number of posts and comments on the Hive blockchain.

Quite a steady numbers with a some spikes in the last period. This is mostly because of the Leothreads, where user have been making a lot of comments lately. It has increased the overall posting activity on the blockchain, or in this case the comments.
More than 40k posts and comments were made few days ago, out of which more than 36k comments.
Even with the sharp drop in the crypto prices, the activity for posts and comments remains healthy.
Number of Votes
The chart for the votes looks like this.
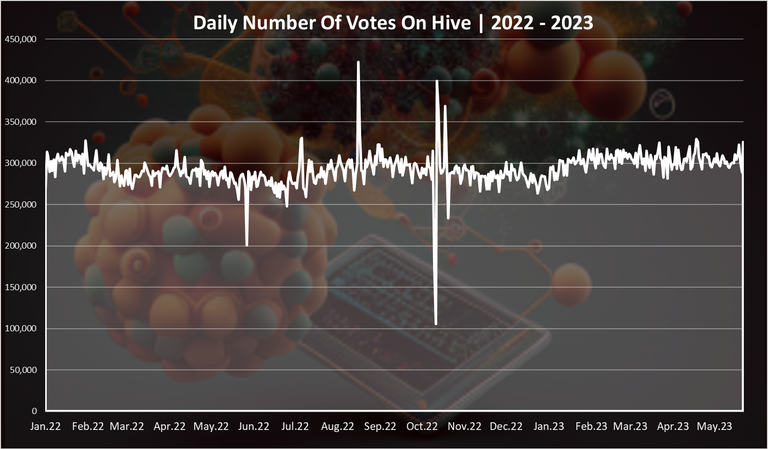
Votes are one of the core operations on the Hive blockchain. That is how the rewards are distributed. The Proof Of Brain mechanism (PoB).
The number of votes has been quite steady in the period, compared to the price volatility.
We can even notice a slight growth in the last period with more than 300k votes per day.
Number of Transfers
The chart for the transactions looks like this.
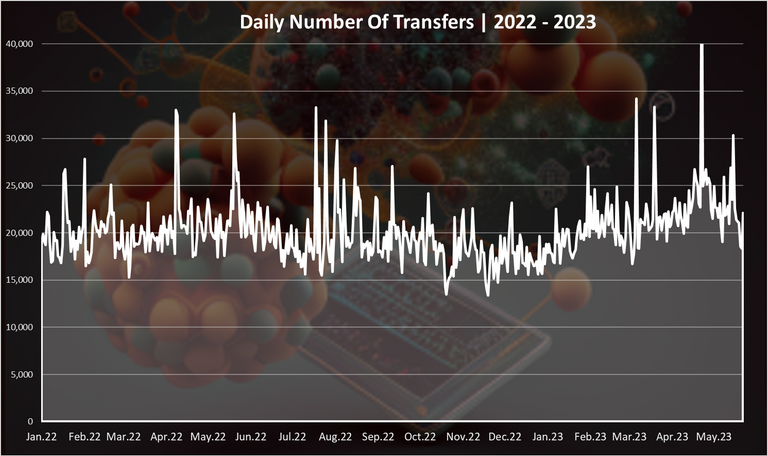
Here again we can notice some spikes in the last months. On occasions there were 40k transfers per day. On average in the last months there is around 25k transfers per day.
Number of Custom JSONs operations
The chart for custom JSONs operations.

This is the number one type of operation on the blockchain at the moment.
Although we can notice that in the last months, unlike the other transactions, there has been a drop here. Most of the operations coming from Splinterlands on the chain are rentals now. The battles are long ago not recorded on chain. Splinterlands have made further adjustments making the adjustments of the price and rental operations with a cost of 1 DEC. This has caused players to further optimize their rentals.
Another app that is making a lot of JSON operation is the Hive Engine platform.
The number of custom json operations in the last period is at 1.5M. At the end of 2022 this number was around 3M.
Monthly Number of Transactions Per Category
The monthly chart presents a better overview of the transactions. Here it is.
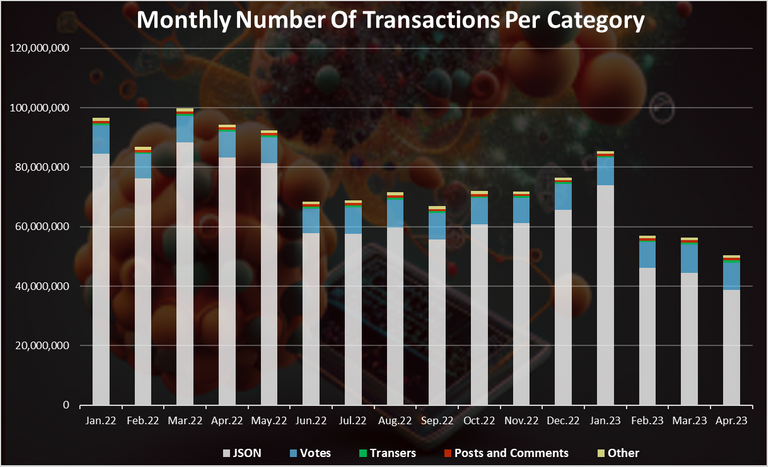
From the breakdown above we can see that the custom jsnos operations are leading throughout the year.
On average around 50M transactions made per month in 2023 on the Hive blockchain.
Top Transactions In 2023
Here is the chart for the transactions per category.
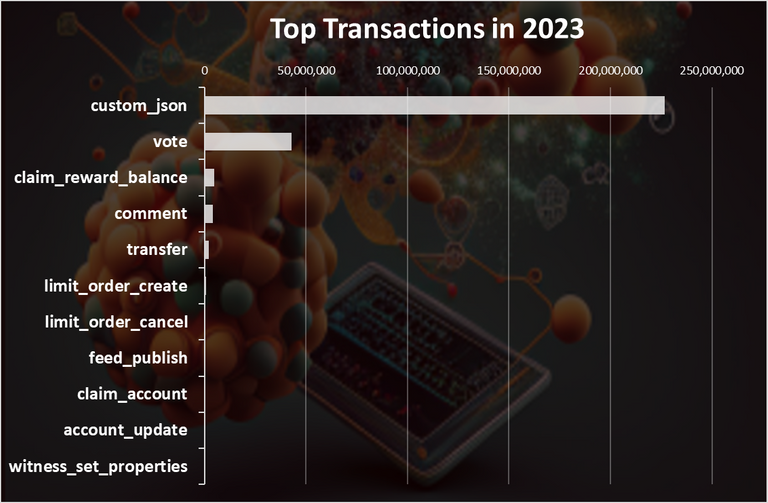
Not surprising, the custom jsons comes on the top with more than 225M transactions. Next are votes with 43M, and interestingly enough the claim reward button on the third place.
Posts and comments are next followed closely by the transfers operations.
Another interesting operations from the list above are the limit orders that are made on the internal DEX. This is as a result of more liquid internal DEX and more trading operations made there, basically using the Hive chain as an exchange. Another of the many functionalities.
The pie chart looks like this:
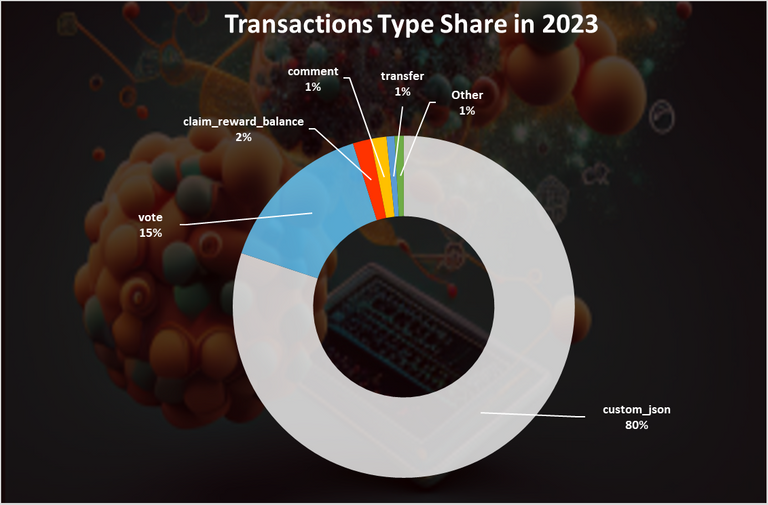
Here once again we can see the dominance of the custom json transactions. An 80% of all the transactions on chain in 2023 belong to this category. The vote operation has a 15% share. The posts and comments, transfers, claim rewards and others are all with around 1% share.
While the custom json operations are dominating the chart, we should have in mind that not all the transactions above have the same weight. Publishing a post usually requires more effort than just clicking an in-game button or clicking the like button.
Summury
Around 1.5M transactions per day now on the chain, down from the 3M in 2022. Mostly because of the lower activity in Splinterlands. On monthly level this number has been around 50M.
It’s interesting to note that the posting, commenting, votes and transfers all have a small growth in the number of transactions on chain in 2023. Apart from them the custom json operations are down, causing the overall operations to go down as well. Even with the drop the custom json operations still consist the majority of the transactions with 80% share.
All the best
@dalz
very informative and interesting as always!
Tnx!
Ohh wow this is impressive, thanks for sharing
Very interesting article. I like that you posted all the numbers with charts included.
Would it be possible to include daily active users in the next one? 😃
I'm in search of account that votes the most or has the most curation reward
?
Steady activities all over the spectrum on the Hive blockchain. I see a decrease in the Custom JSON, but I think some of them are due to optimizations and fewer interactions that require such transactions. Besides this, we are still in a bearish market and when that will turn around, I expect a new uptrend in term of transactions and interactions on the blockchain.
Yep, still low prices ... patiance is the name of the game :)
@taskmaster4450
PROOF POSITIVE:
THAT MONEY EXTRACTION FROM THE POOR WORKERS IS THE REAL HIVE GAME.
HENCE: ONLY MONEY CHASERS COME AND STAY.
READS: BOTTOM DWELLERS COME TO TEND THE COTTON, (EAT CRUMBS) WHILE TOP SKIMMERS TAKE THE HARVESTS.
THIS IS CLEARLY EVIDENT TO THE INFORMED VIEWER.. AND ALSO CLEARLY WHY HIVE EXISTS IN OBSCURITY. HIVE INNER CIRCLE DON'T WANT GROWTH.
THEY JUST NEED THE WORKERS >>BELIEVING<< GROWTH WILL COME.
That's a lot of numbers and I am happy to know that we still have a bit of steady activities in terms of comments, posts and comments on the chain even though we are still in the bear season. I am sure well see a peak in these activities when the market is up ad running in greens again.
That's great to see all hive activities
Great to know about this progress happening on hive and thanks for sharing.
You welcome!
Good work this is very important and useful information to track transactions data on hive which definitely help us to understand what's happening right now
Tnx!
https://twitter.com/LovingGirlHive/status/1661262093205778432
Glad to see interaction on the hive blockchain has increased due to Leo Finance threads, It is a good sign, thanks for this detailed analysis. though the prices of crypto markets is down we are still getting good engagement on hive blockchain.
Nice one Dalz. I presume the drop in custom JSONs is then related to less Splinterlands rental market transactions with the fee and fewer bots. Thanks for the charts and overview.
Really cool to see more posts on Hive. That means we're adding more long term users on social media side. Some of them will eventually try out games. I see it as a good sign. If folks post more in this market - imagine interest in a bull market :)
This shows me how strong is our network and that we are ready to handle a massive grow of user and our network will not collapse like others did.
https://twitter.com/lee19389/status/1661653740581945345
#hive #posh