Ethereum Inflation, Supply, Staking and Other Key Metrics | Jan 2024
How is the Ethereum network doing these days? There has been some positive price action in the last months and a lot of L2 activities. It seems that a new L2 on Ethereum is born each day. How is this impacting the network?
Since the PoS update the inflation was reduced by 90%, from 4.3% to 0.43%. Additionally, part of the ETH for transactions is burned, that pushed Ethereum into deflationary territory. Meanwhile, the share of staked ETH kept on growing drying up the liquid ETH supply.
Let’s take a look.
Image background generated with Midjoureny
Here we e will be looking at:
- Overall Supply
- Number Of Wallets
- Active Wallets
- Transactions
- Fees
- Staked ETH
- Contracts
The data presented here is mostly gathered from the etherscan charts and Dune Analytics.
Supply
The overall supply now looks like this:
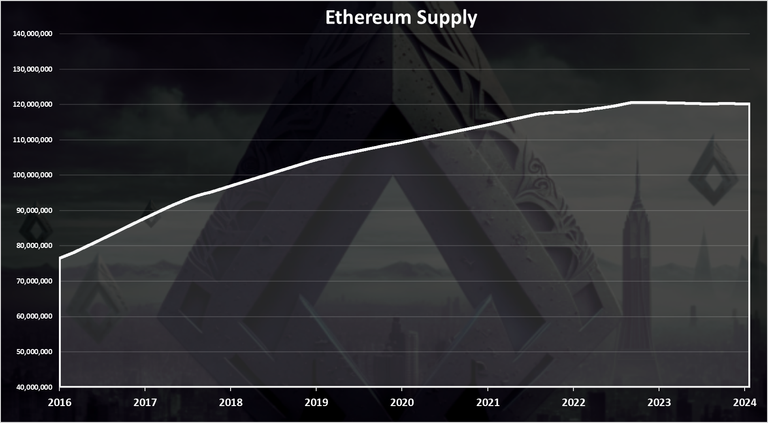
A steady increase in the supply from just above 70M in 2015 to 120M where we are now.
We can see that in the last period after the merge, the supply has been almost stagnant, and even drop a little.
Ethereum Supply After the Merge
The chart for the new ETH issued after the merge and the transition to proof of stake looks like this.
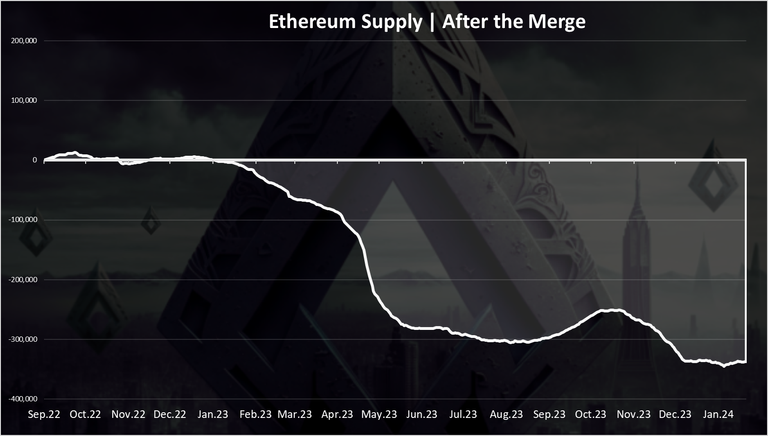
Overall, ETH has been deflationary in the period. But for how much? In absolute numbers it’s around -336k ETH, while in relative number it is -0.28%.
We can see that while small, 0.28% is a visible number and the ETH supply tends to be deflationary now. Depending on the market and the overall transactions on the network this number can go up or down.
We can see that a lot of the burns happened in the first half of 2023 when there was more activities on the network. In the second half of the year there was not much burning, and on occasions the supply started growing again. In December 2023 there was again a drop in the supply.
The chart for the yearly inflation looks like this.
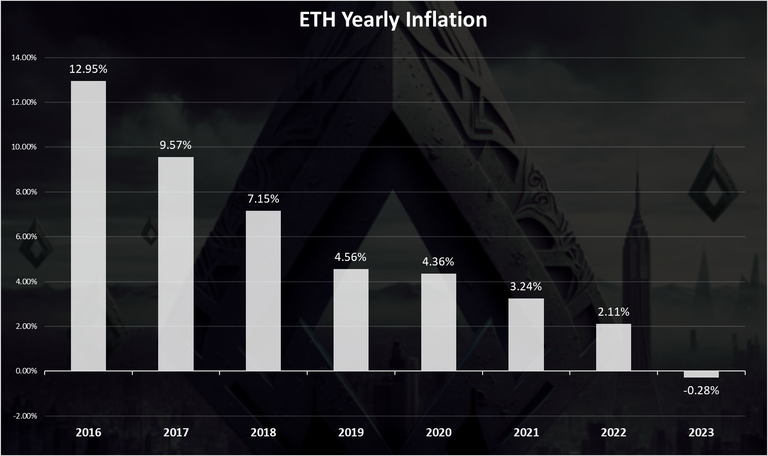
From more than 10% down to negative -0.28% in 2023. The last year was the first year in which Ethereum ended with deflationary supply. Will see how it will go forward, but even the maximum is at 0.4%, that makes Ethereum quite a hard asset.
Number of Wallets
Now for the general network numbers.
Here is the chart for the total number of Ethereum wallets created.
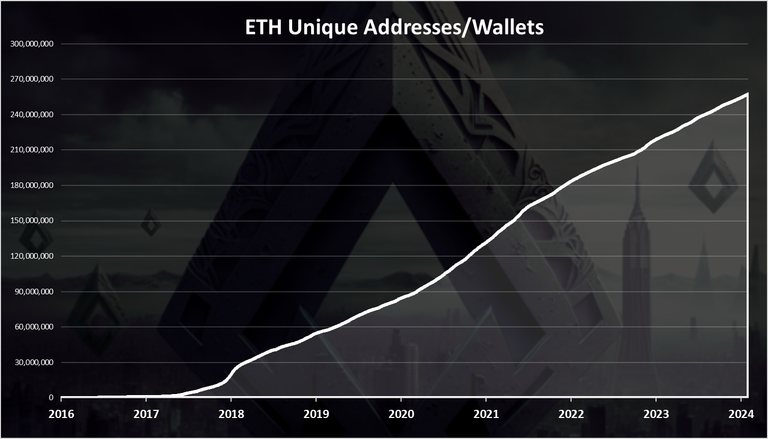
Ethereum now has more than 257M wallets! The numbers of wallets keeps growing at a steady pace.
When we look at the number of new daily wallets created we get this chart.
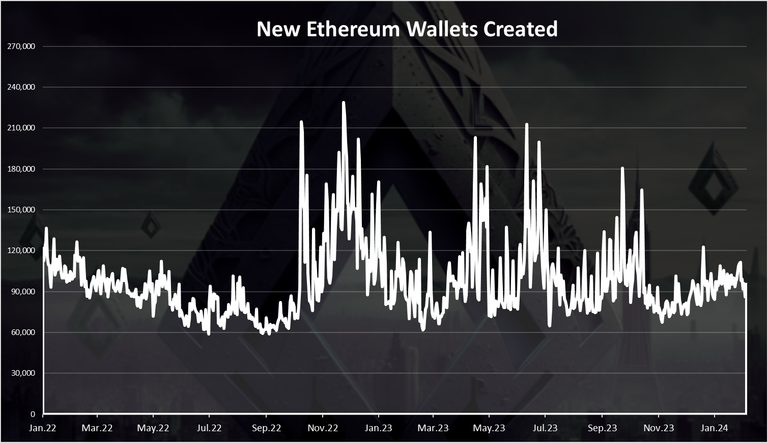
This is starting from 2022.
A steady number of new wallets created and then a spike after October 2022. From 70k up to 230k per day. After December 2022 the numbers went down again and up again in May 2023 to 200k. In the last period we have around 100k new wallets per day.
Active Wallets
How many of them are being used?
Here is the chart.
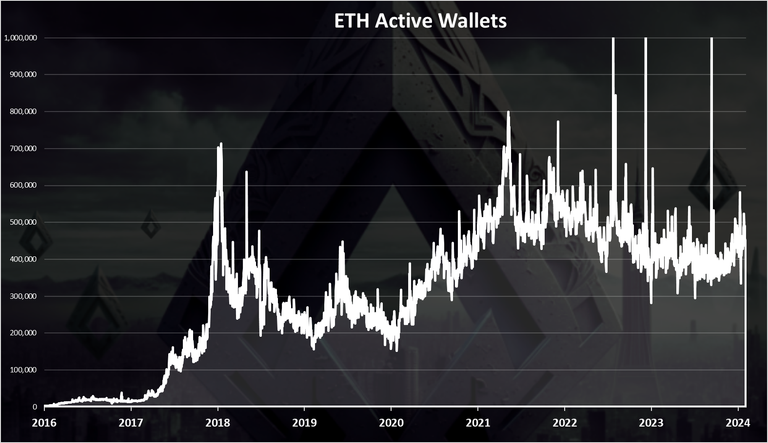
We can see that there was an overall uptrend up until 2021, reaching around 700k active wallets. Since then, there has been a downtrend up to December 2023, when it started growing again, from 400k to 500k active daily wallets.
Transactions
How about the number of transactions? Is the Ethereum network now more active after the merge? Here is the chart.
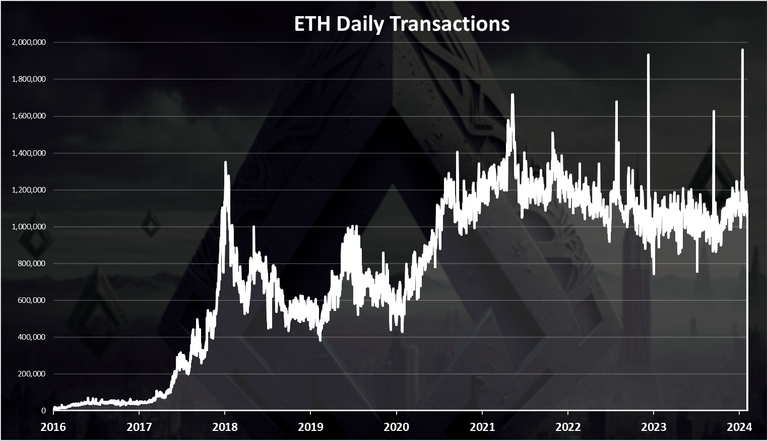
There was a spike in the transactions back in the bull market of 2017, up to 1.4M, then a drop to around 500k per day. In the previous bull market in 2021 the ATH was somewhere around 1.8M transactions per day, a steady drop since then and a growth again in December 2023, and we are now somewhere around 1.2M transactions per day on the Ethereum network.
Fees
There was misunderstandings that the merge will make the fees on Ethereum smaller. But this is not the case. The merge is a consensus upgrade, not a scalability upgrade.
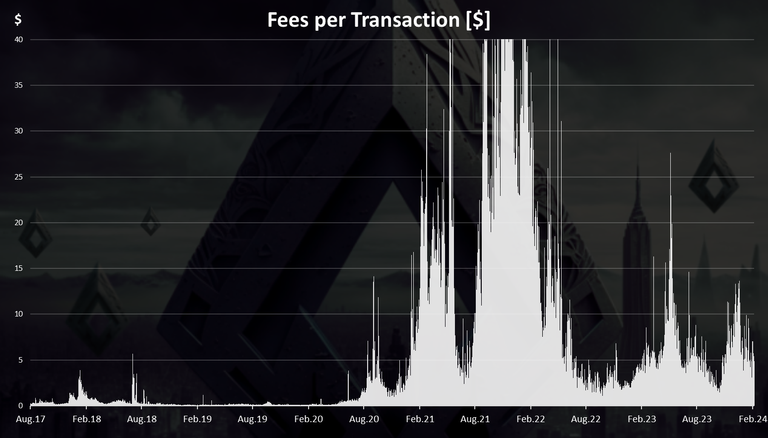
At first there was a small increase in the fees back in 2017-2018 bull run. Then in the next bull ran a massive increase in the fees up to $100 at one point. A drop in 2022 and since then it has been in the range of 5 to 10 USD.
Staking Ethereum
Staking a big topic in the Ethereum network since the PoS upgrade. Here in short will just check the share of ETH staked from the overall supply. Here is the pie.
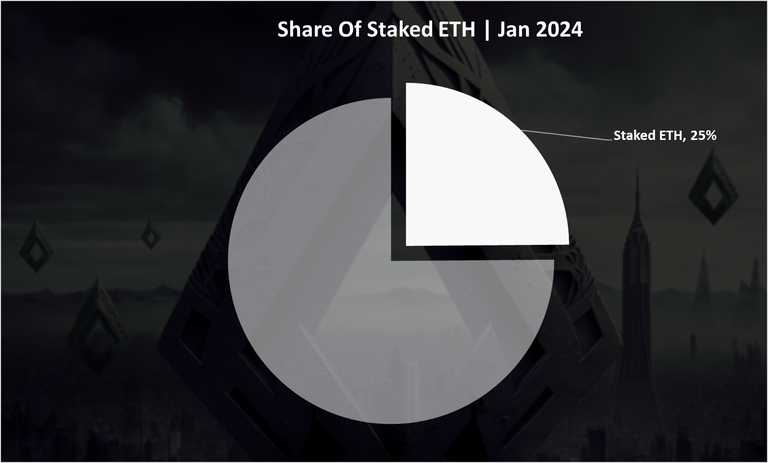
A 25% staked ETH from all the supply. The trend for the staked ETH has been constantly up in the last period. For a token of this size and market cap this is quite a big share.
Number of Contracts
Here is the chart for the number of smart contracts deployed daily.
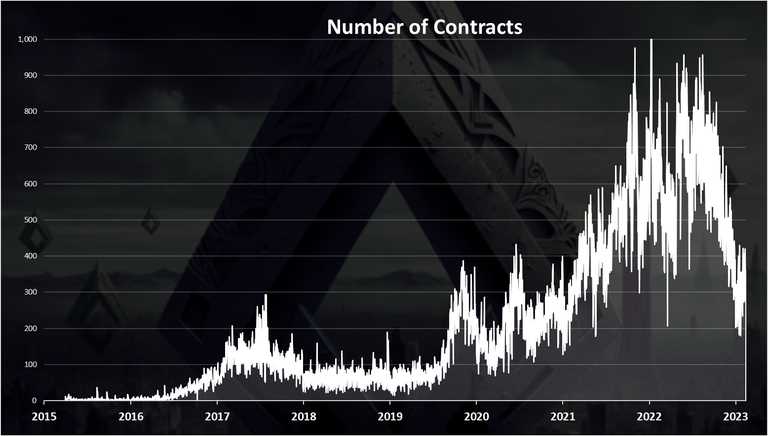
Interesting this number is up a lot in the last years compared to the previous period. A dip towards the end of the year. On average there are around 300 contracts now, while at the top this number was up to 900.
In summary the most noticeable change in the last period is that after a period of constant deflationary pressure on the supply, it has stabilized. The activity has increased toward the end of 2023 resulting in higher numbers for active wallets and transactions.
All the best
@dalz
The lower in inflation and the increase of staked ETH are definitely thrilling aspects. Nevertheless, I am curious about the consequences that those changes have delivered to Ethereum’s decentralization and safety. However, I wonder about the implications of Ethereum deflationary stock for token holders and buyers.
Love the stats!
Thank you for the statistics!
Interesting data. The problem with Ether is that in principle it had to be the fuel that moved the machine but now it seems to be more the machine itself. A value to preserve. For me this doesn't make sense.
It is great to stay informed with this stats
Thank you so much for sharing this
I'm also studying statistics it's quite difficult subject for be because I'm medical student
More how overcoming strategies must be followed
Ethereum is rocking nowadays but the gas fee for bitcoin keeps going up
Thanks for doing this @dalz. Very valuable information!
Thanks!
The number of ETH wallets already created is astonishing, so also is the inflation rate. Thanks for this insightful stats about Etheruem. Have a nice day.
The decrease in deflation leading up to a negative inflation is nice to see. It seems ETH is going in a better direction. I wonder how it will react once the ETH ETFs are approved.