A Look At The Hive Debt | Data On HIVE/HBD Supply, Historical Debt, HBD Performance | July 2023
The Hive debt is an essential parameter for the Hive ecosystem. The stability of the HBD depends on it. If the Hive debt grows above the debt limit that is set by the chain, then the value of HBD will drop. Since the last Hardfork in October 2022, this limit is set to be at 30%. Before, it was set at 10%.
Let’s take a look how has the debt performed in the last year market conditions.
The Hive debt is calculated according to the following formula:
DEBT = HBD in circulation / HIVE Market Cap
More details how exactly is the Hive debt calcuated.
There are nuances when calculating the debt as it is not straight forward. A few things to consider: exclude the HBD in the DHF, take the HIVE virtual supply as a HIVE supply, and the feed price from the blockchain. More details in the post above.
Here we will be looking at:
- HIVE supply
- HIVE market cap
- HBD supply
- Historical debt
- HBD market and on chain price
The period that we will be looking at is from the very beginning 2016 - 2023.
HIVE Supply
As already mentioned, when looking at the HIVE supply there are two data points. The regular HIVE supply, that is simply the amount of HIVE tokens in circulation and the second one the virtual HIVE supply that includes the theoretical HIVE that can be converted from the overall HBD supply.
Here is the chart.
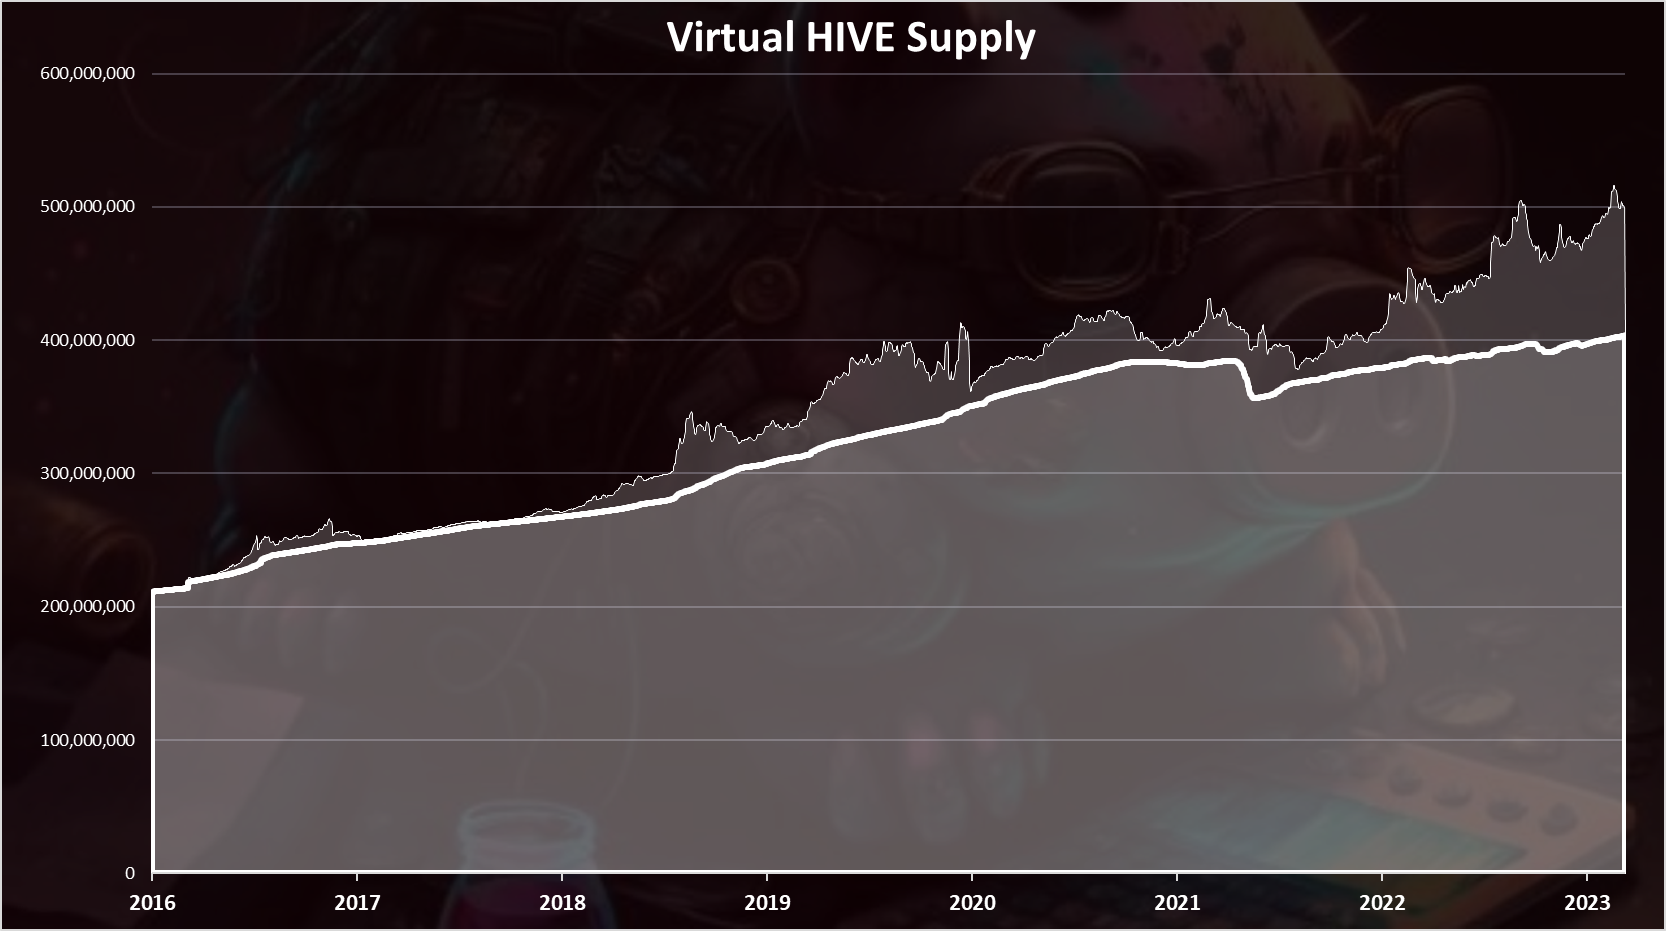
This is the all-time chart for the supply starting from 2016, including the old versions 😊.
The light color on the top is the virtual supply.
We can see that the supply started from just above 200M, and now we are at 400M. It doubled in the period of seven years.
We can also notice that in the last years we have a drop in the supply, and ups and downs. This is due to the two ways conversions and burning HIVE for HBD.
Another thing to notice here is that the virtual supply has increased. While this is due to the low price for HIVE it is also because of the HBD in the DHF, that is included in the virtual supply. On the other hand this HBD has increased a lot in the last two years and it is now increasing the virtual HIVE supply. Excluding the HBD in the DHF from the virtual HIVE supply might be a better option, but the chain is set to calculate this as well.
When we zoom in 2022-2023 HIVE supply, we have this:
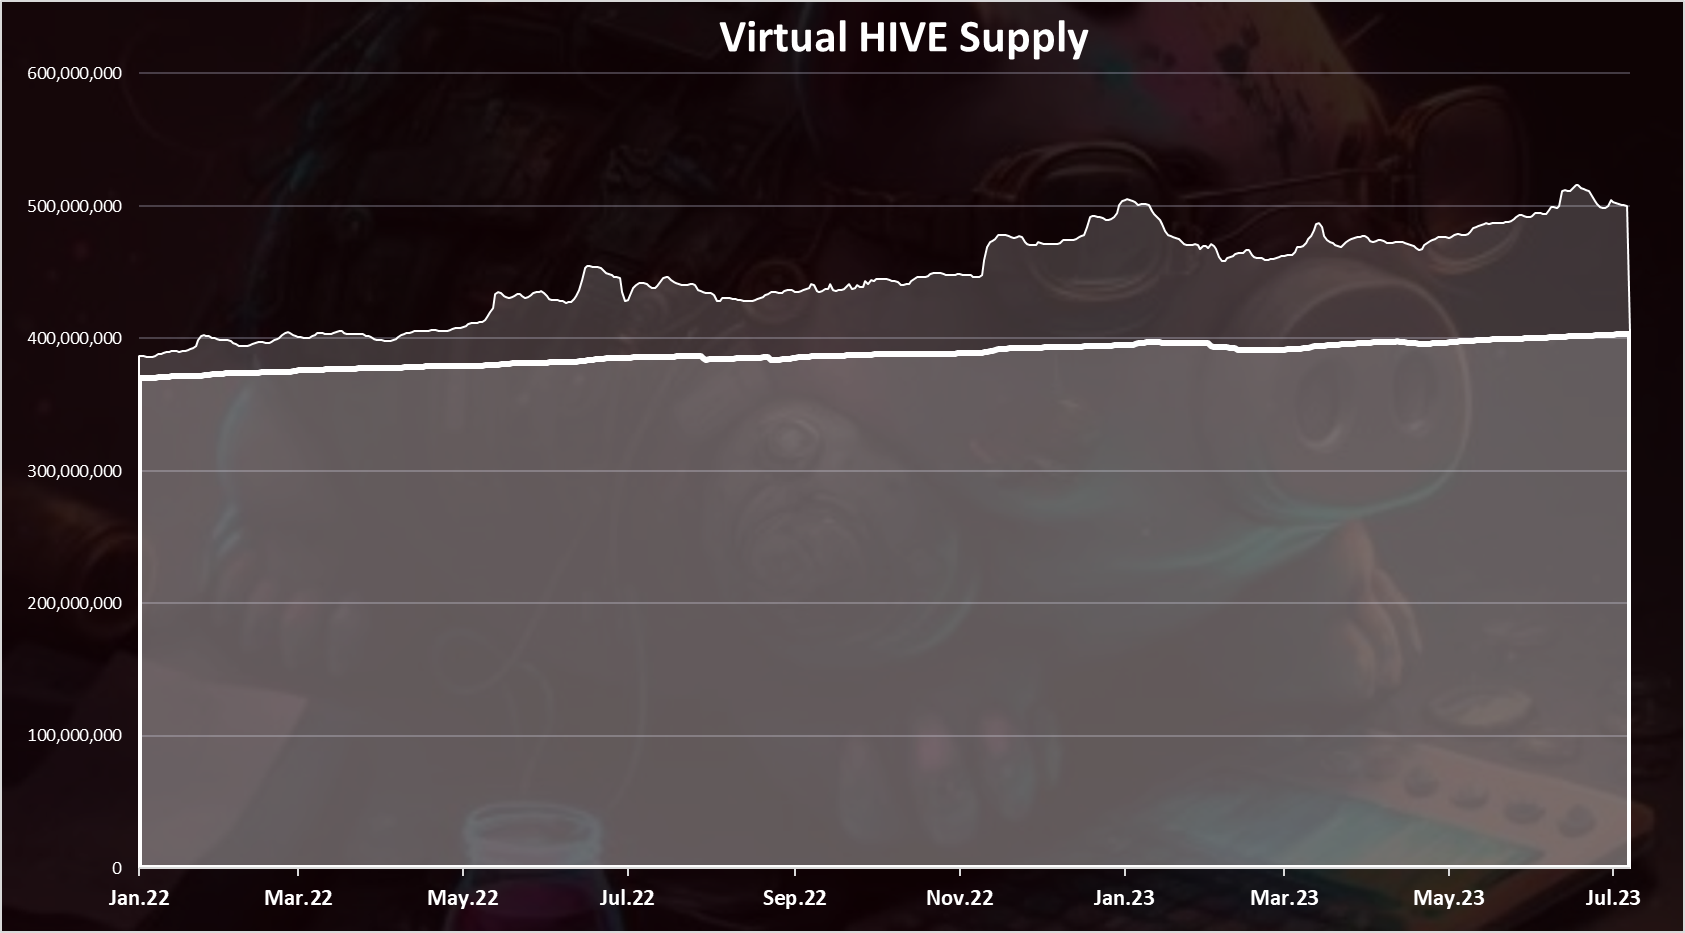
This period represents the recent happenings. At the beginning of 2022 the HIVE supply was 370M, while at the end of 2022 it was 395M.
We are now at 403M HIVE, adding an additional 8M HIVE in the first half of 2023. The realized inflation is still lower than the projected in 2023. The virtual HIVE supply is now at 500M.
HIVE Market Cap
As mentioned, the debt takes into account the HIVE market cap, including the virtual HIVE supply. When calculating the market cap for the debt we multiply the virtual supply and the feed price for HIVE, not the market price.
Here is the chart for the market cap:
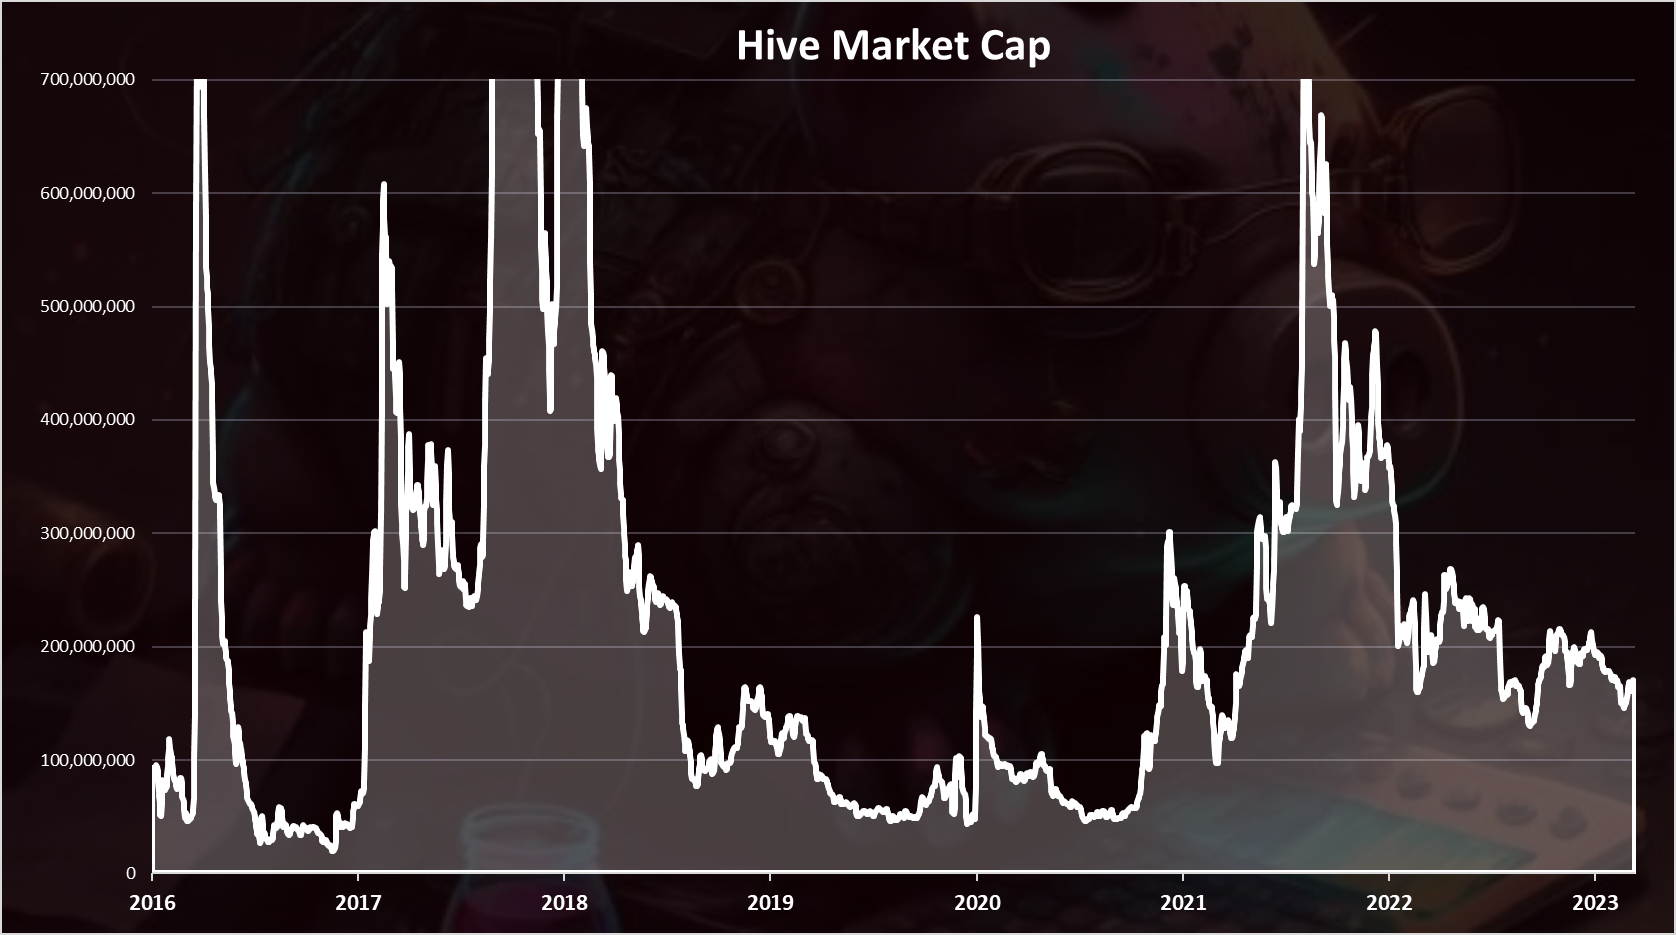
A lot of volatility and oscillation here. It’s not a surprise having in mind the relative small market cap of the token. In both of the previous bull markets HIVE reached more than 1B in market cap. Now we are around 160M. More than 80% drop.
HBD Supply
Next for the HBD supply.
Here is the chart.
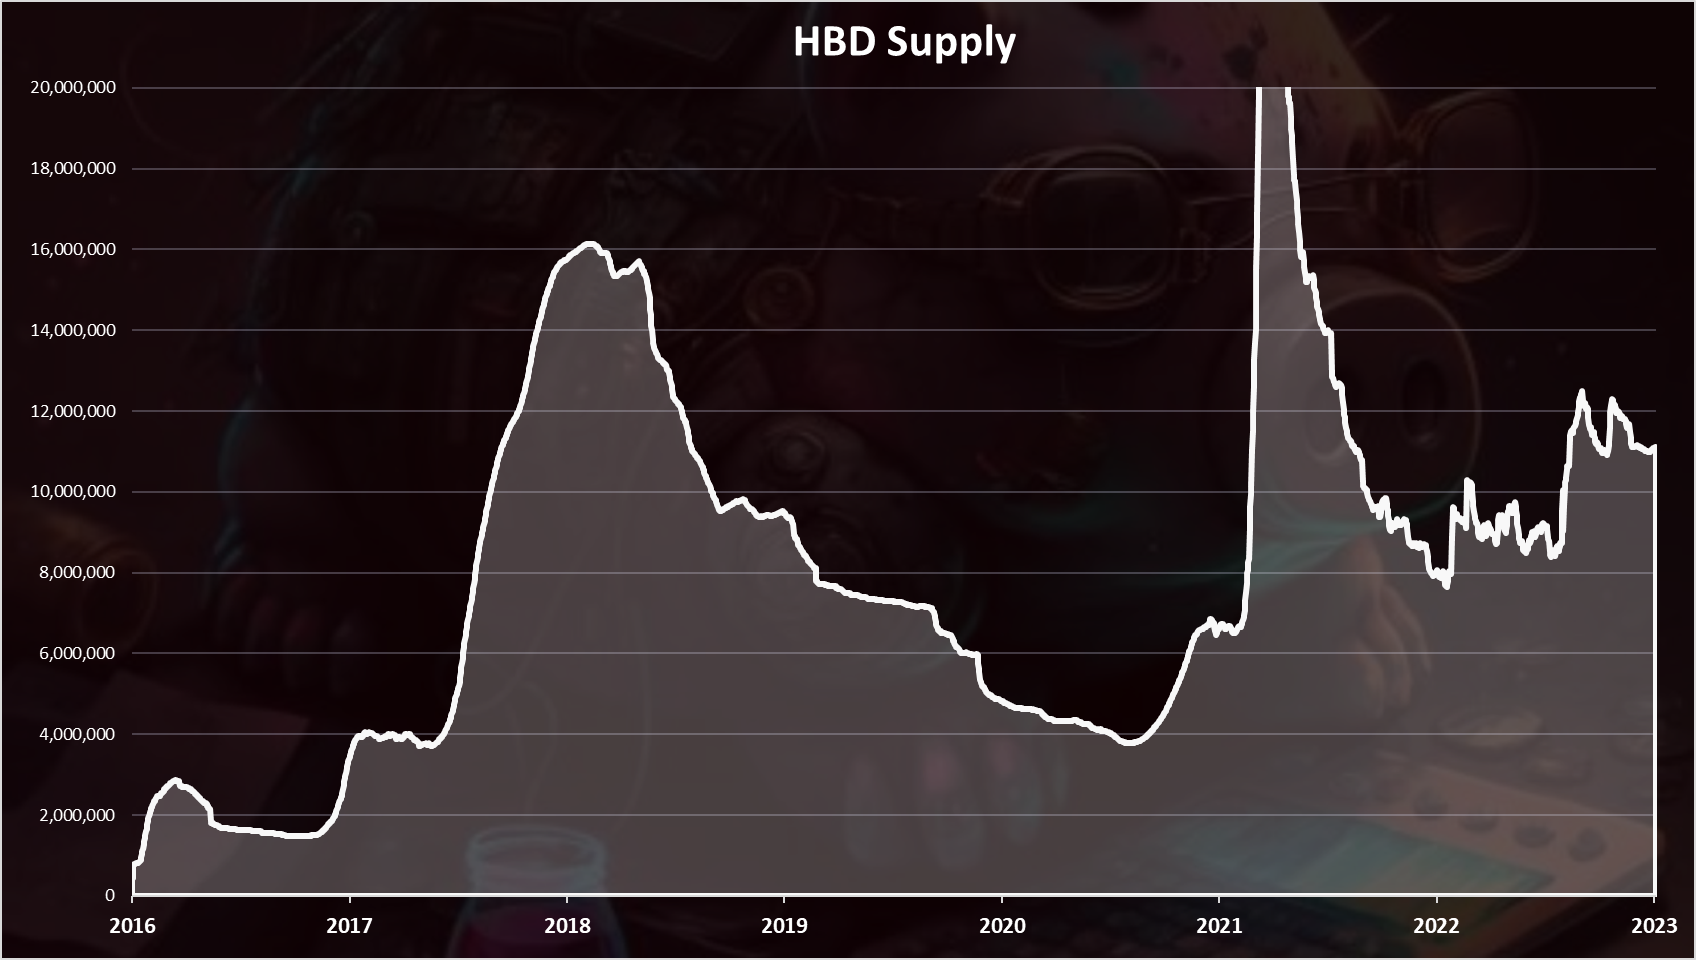
Note: This chart doesn’t include the HBD in the DHF that is now a dominant HBD holder with 21M.
We can notice the two peaks in the supply in both of the previous bull markets. First in 2018 when there was around 16M HBD, and then later in 2021 when for a short period of time the HBD supply reached 25M. Now we are around 11M.
Hive Debt
When we apply the above, we get:
DEBT = HBD in circulation / HIVE Market Cap
DEBT = 11M / (500M * 0.33) = 6.7%A 6.7% debt in July 2023.
The chart for the historical debt looks like this.
This is the all-time chart with years starting from 2016. We can see that in the past the debt limit was broken on two occasions.
First in 2018 and it lasted for a short period of time, and then again in 2019 and it lasted for six months.
In October 2021 there was another breach of the 10% limit but for just a few days. This happened after a massive expansion of HBD in August 2021 when a lot of HBD was created because of the high HBD price, the supply was at 24M, but it was fast converted back, pushing the HBD supply down, and the debt.After the last change and the increase in the debt limit, we are now far from breaching it. In fact from the creation fork for Hive, back in 2020, the debt limit didn’t had any significant breach and the HBD price didn’t break the peg on the downside.
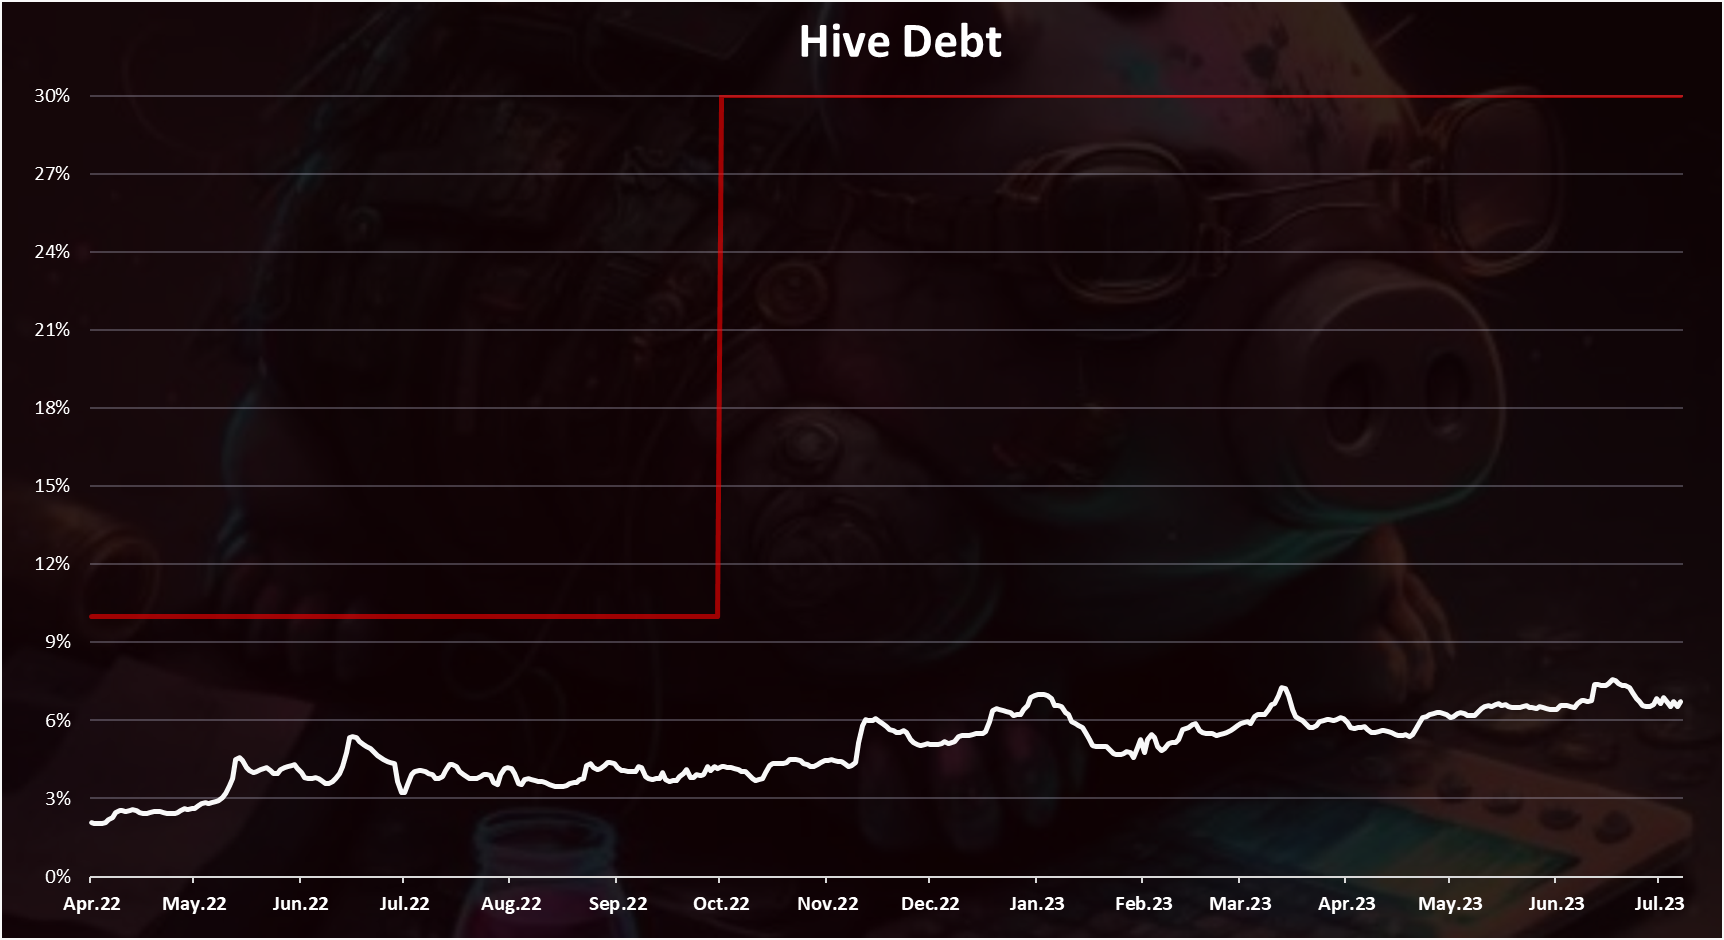
When we zoom in 2022-2023, we got this:
We are now far from a debt breach and in the safe zone. The overall debt has slightly increased int the last two years, goring from around 4% to 6% where we are now. But it is still far from the 30% limit.
One conclusion that we can get from the above is that HBD holders seems to be careful with HBD, they know the risk of HBD loosing the peg if the debt is reached and everyone is adjusting their positions reducing the HBD supply in the bear market.
Debt VS Market Cap
Now a few comparison charts against the debt.
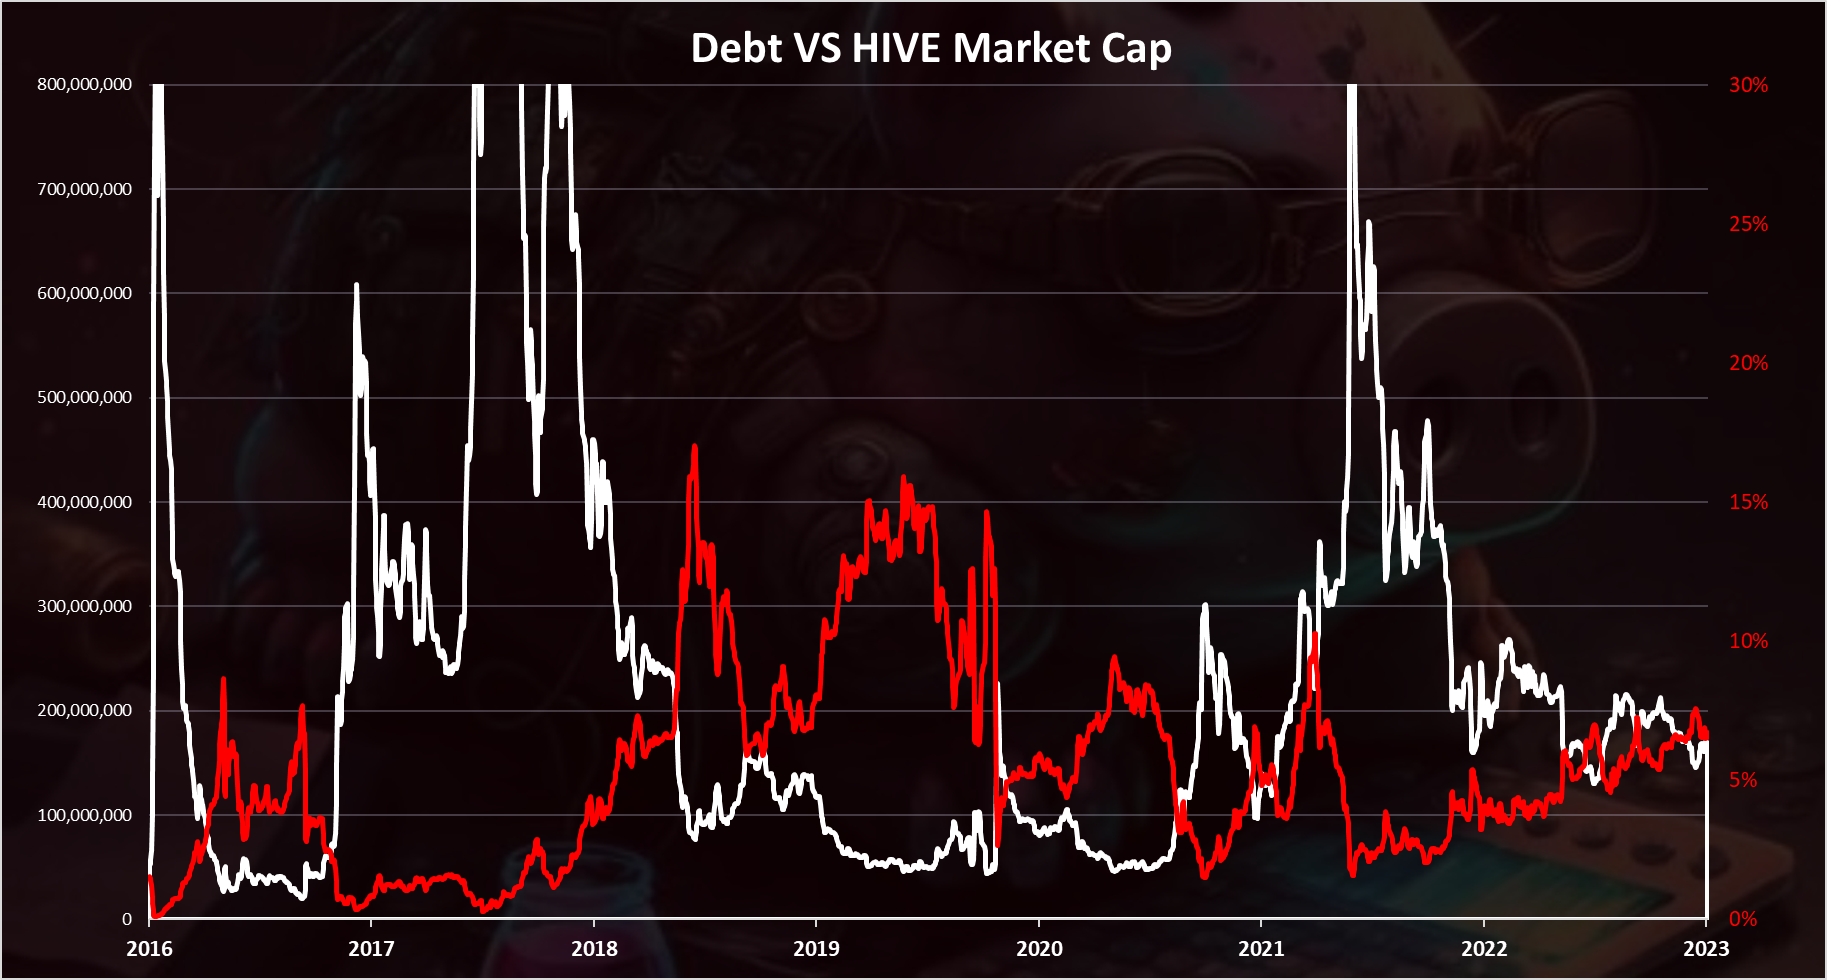
First the market cap.
If we plot the debt and the market cap on one chart, we get this.
The overall trend here is the drop in the market cap is inversely corelated with the debt. As the Hive market cap drops, the debt increases. Although we can notice that it has been a much smoother ride in the last two years, unlike the first years.
Debt VS HBD Supply
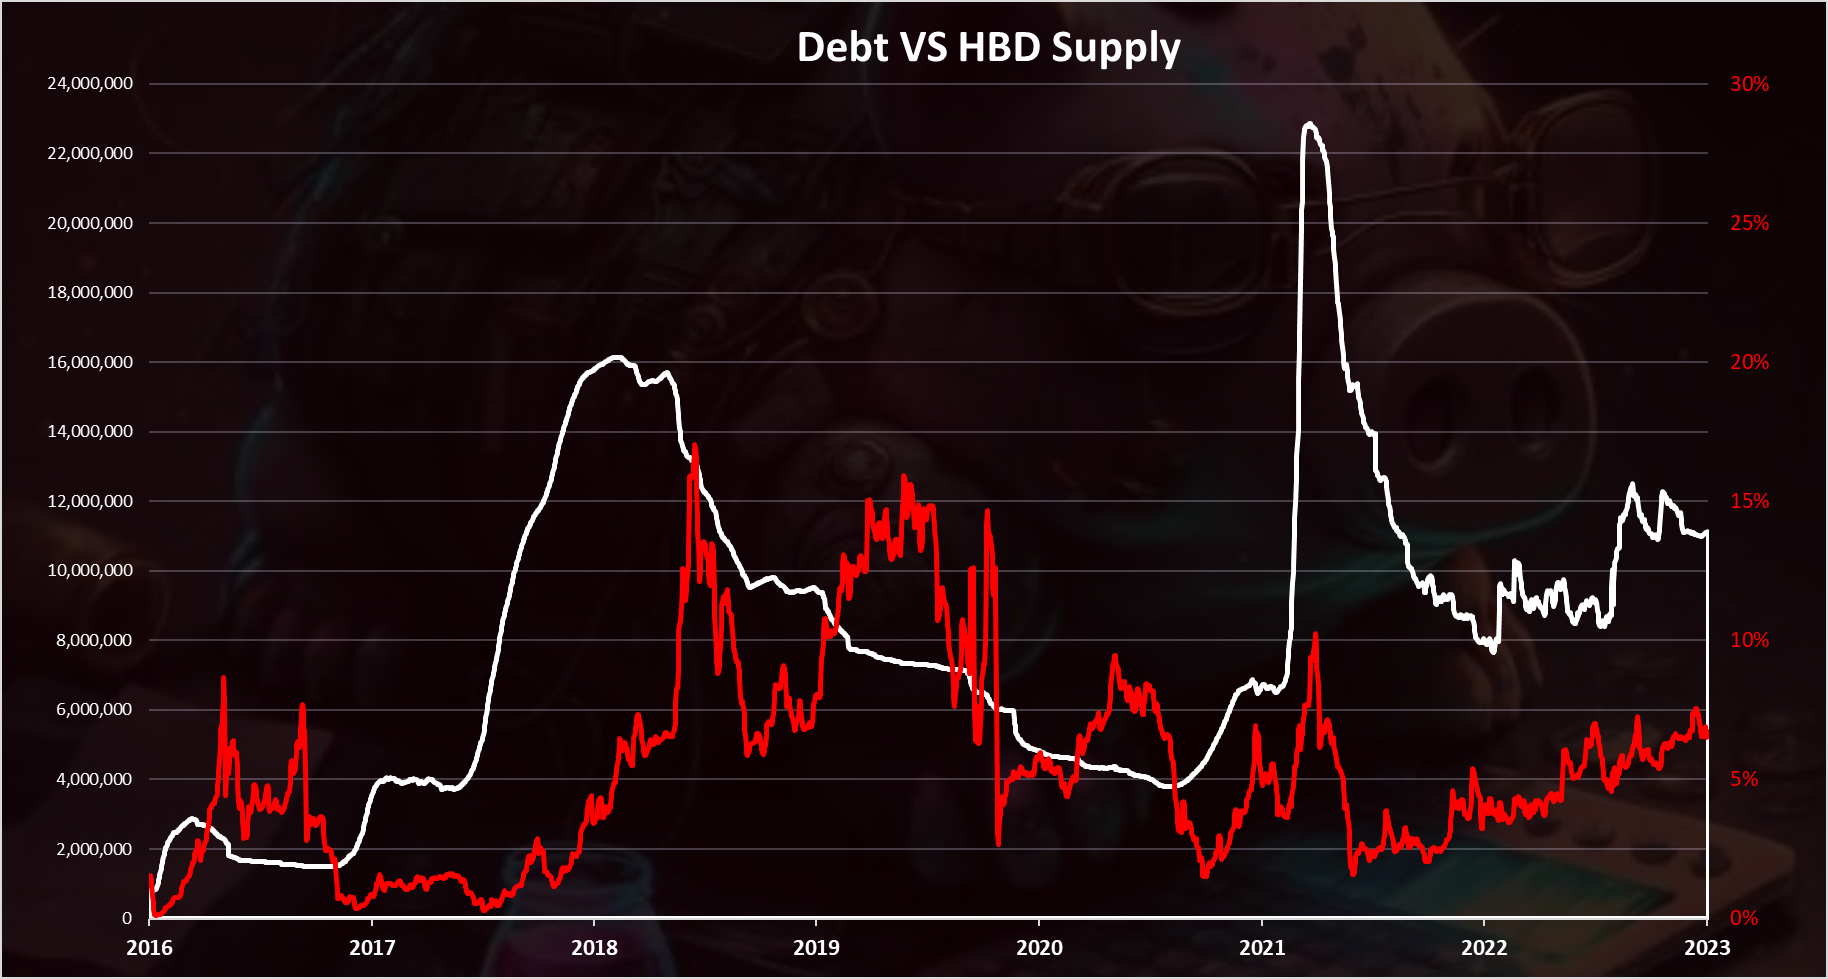
Here is the chart when we plot the debt against the HBD supply.
Some trend from above is first we have an expansion in the HBD supply and then an increase in the debt. The debt usually lags a bit after the expansion of the HBD supply.
But again, we can see that in the last two years we have a more stable situation with small increases in the HBD supply and the debt.Debt VS HBD Prices
The one thing that everyone around doesn’t want to see is a drop in the HDB price.
But HBD losing its peg is by design and it has happened in the past. The debt is the key parameter when this happens.
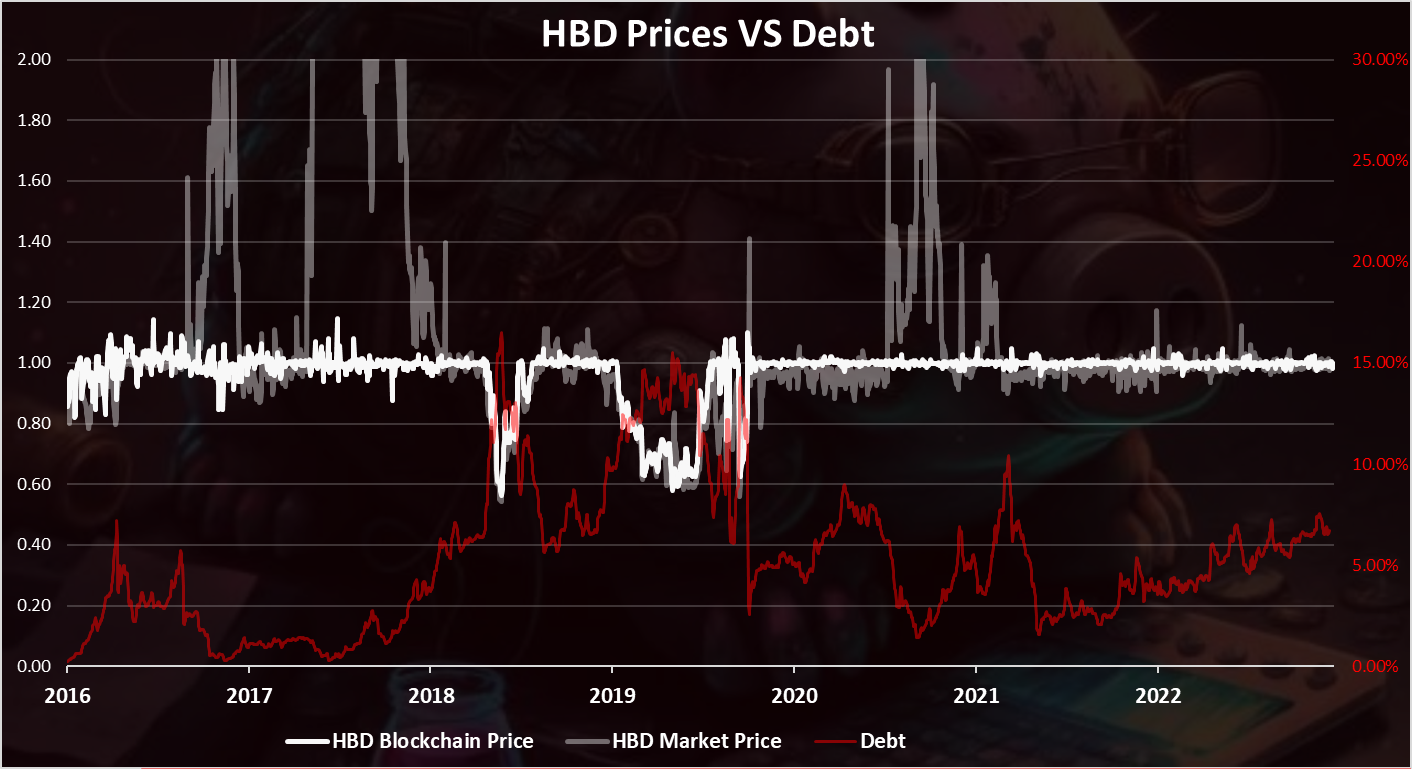
Here is the chart.
This is a long term chart for context.
The strong white is the HBD price that the blockchain provides when converting HBD to HIVE. The grayed out is the HBD price on the external markets and the red is the debt.
We can see that the market price for HBD, formerly SBD, has never dropped below the price levels that the blockchain provides. The gray line has not dipped significantly below the white line.But the blockchain price itself has lost its peg whenever the debt was above the limit. For a short period of time in 2018 and once again in the second half of 2019 when it lasted longer, for more than six months. In this period the debt level was more than 15%. The HBD/SBD price at the time reached as low as 0.6$.
From 2020, up to today the HBD price haven't lost its peg on the downside. More than three years now!
It has increased in price in 2021, trading close to $2 for a short period of time, but becaouse the HIVE to HBD conversions were enabled at the time, the peg was quickly restored. Since then it had a few very short lived pumps on the HBD price to 1.2.What price will the blockchain value HBD after the 30% debt limit is reached?
This depends how high the debt is. If the debt is higher, the HBD price will be lower.
Example table:
Debt level HBD On Chain Price < 30% 1.00 40% 0.75 50% 0.60 60% 0.50 As we can see from the table, for a debt level between 30% and 40%, the HBD on chain price will be in the range of 0.75 to 1.00. For a debt level higher than 50%, the HBD on chain price is closing on the 50 cents mark. But as we have seen historically the lowest the lowest HBD has been is 60 cents. Now with the increased debt limit, it is even harder to reach such lows, as there will need to be a significant increase in the HBD supply on one side, and a sharp drop in the HIVE price. While not impossible it very hard to happen, especially in a short time frames, as the two contradict each other.
Live data for the Hive debt here:
https://www.hbdstats.com/All the best
@dalzPosted Using LeoFinance Alpha


It's wonderful to see that HBD is performing as intended :) Thanks so much for the stats 🙌
This post has been manually curated by the VYB curation project
Tnx!
Thanks for the great overview as usual. Looks like it was a quiet month.
Tnx!
I don't have any idea about that but know I understand about these terms.
Keeping ones head above water while still growing not something to be sneezed. Thanks for graphs and detailed reading over time.
Thank you for the information
There are times when I wonder how you all get this information
Nice one!
Well, I can easily predict we are doing quite well after looking into these charts and reading the information you have provided in this post. It's a detailed post.
The way we've seen it last year is that many of coins has dropped below a dollar, but it's held up very well because people have a lot of faith in it. Thanks for sharing this great and valuable review with us.
Buen día mi amigo un gusto leer su contenido sobre la economía de Hive, aparte de ser educativo pues aprendo más sobre ese activo digital.
A great thank you for giving us this information 😊
Congratulations @dalz! You have completed the following achievement on the Hive blockchain And have been rewarded with New badge(s)
Your next payout target is 48000 HP.
The unit is Hive Power equivalent because post and comment rewards can be split into HP and HBD
You can view your badges on your board and compare yourself to others in the Ranking
If you no longer want to receive notifications, reply to this comment with the word
STOPCheck out our last posts:
Hello my friend, your analysis is very interesting, I am quite new here but reading all this gave me a lot of information about the past and present of Hive debt which I really did not know, but I am really grateful for the information and graphs of the behavior of supply, prices and debt of hive.
We learn how this precious blockchain works thanks to such posts.
Thank you!