Monthly Chart of Bitcoin Looks Horrible
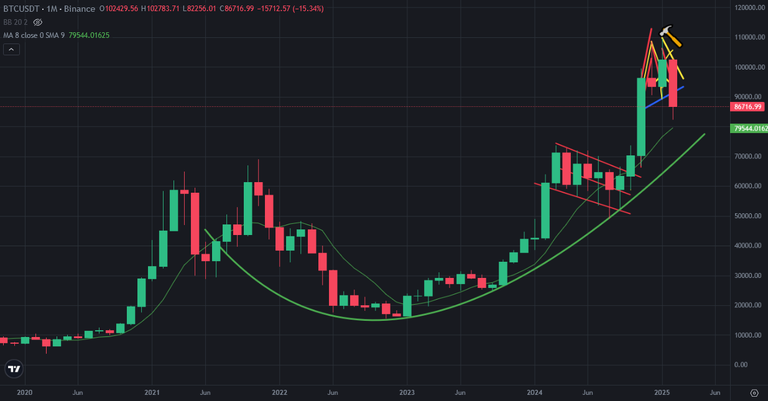
We have not seen successive red monthly candles on Bitcoin price chart since August 2023. Bitcoin got 15% monhtly candle in this month. Even we have not seen successive red monthly candles on Bitcoin price chart, it looks horrible.
Here you can see monhtly chart of Bitcoin. This is 5th monthly red candle in last 18 months. Even we saw lots of green monthly candles, It may be end of trend. We should be careful. It we see red monthyl candle in March, Mega downtrend line may start on Bitcoin price chart.
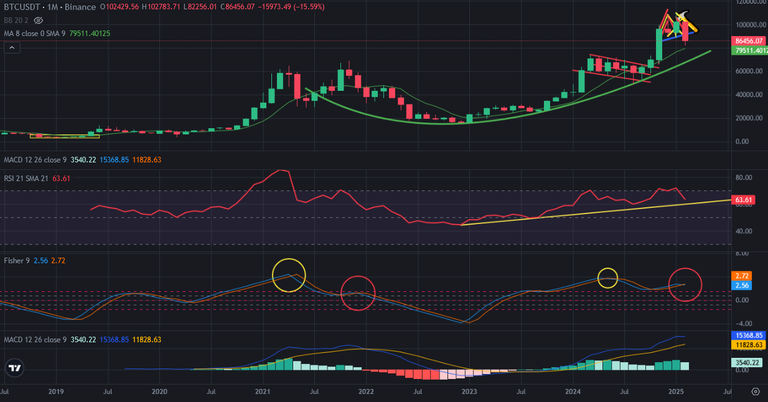
Here you can see the indicators on monhtly chart of Bitcoin. There are lots of similarities between 2021 and now. I circled the similarities on Fisher Indicator. Fisher Indicator reversed down from the top. You can see what happened after reversing down. There is uptrend line on RSI Indicator. It may support Bitcoin price. If not, we will entere mega bearish trend on Bitcoin price chart.
MACD Indicator is at safe level. It we see more red candles on monthly chart, MACD Indicator will reverse down and we will enter mega bearish trend.
There is uptrend bowl pattern on Bitcoin price chart. Bitcoin price may touch this support line. I hope it will not break down. We should be careful and follow the trend.
We will see...
Posted Using INLEO
This post has been manually curated by @bhattg from Indiaunited community. Join us on our Discord Server.
Do you know that you can earn a passive income by delegating your Leo power to @india-leo account? We share 100 % of the curation rewards with the delegators.
100% of the rewards from this comment goes to the curator for their manual curation efforts. Please encourage the curator @bhattg by upvoting this comment and support the community by voting the posts made by @indiaunited.
How low it can go ? I see some effects started already.