Hive Price Supported by the Middle Line of Depression Zone
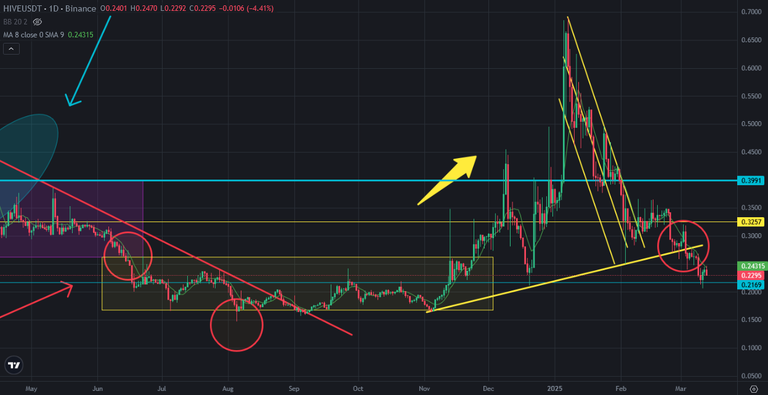
Hive price was in depression zone in 2024. After great start on 2025, Hive price touched 0,70 USD. Hive price entered price correction due to Bitcoin price dump. It is good to see Hive price supported by the middle line of depression zone. Even lots of altcoins are at all time low, Hive price did not toouch the bottom of depression zone. The middle line of this zone may be the bottom.
Here you can see daily chart of Hive and my drat I shared it a few years ago. It works as well. The middle line of depression zone supported Hive price a few times. It may be the new time for Hive.
Here you can see the indicators on daily chart of Hive. There is great downtrend line on RSI Indicator. Hive will break it in a few days. MACD Indicator is at good level to reverse up. Fisher Indicator is also good level to go up. We may see price pumo on Hive price chart.
Daily chart of Hive price started to seem bullish. When we see reversing up on the indicator Hive price will go up safe level. The top line of depression zone is the first target for Hive price..
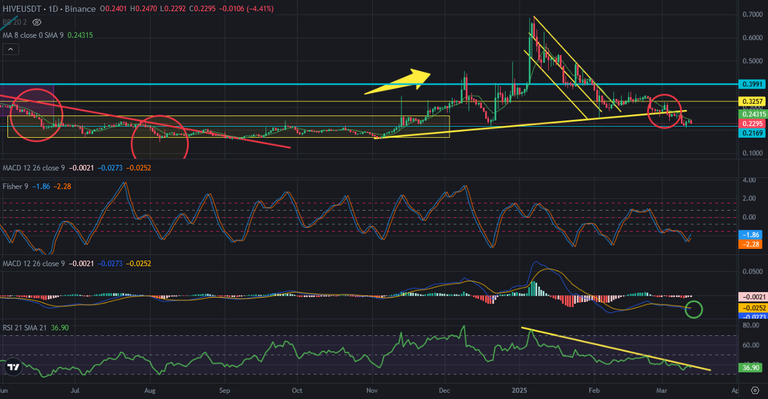
So, we are so close to break ups on Hive price chart. We should see Hive price on 0,26 USD to draw new pattern. New pattern will be for bullish.
We will see..
Posted Using INLEO