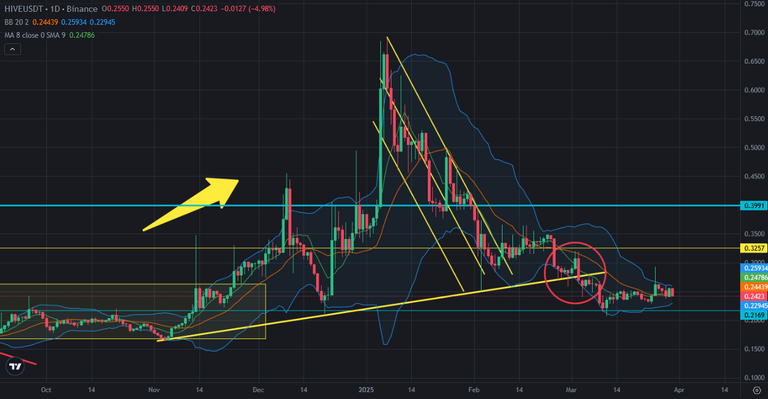
Hive Price Stucked Between Bollinger Bands
Hive price is moving between low range. It is stucked between bollinger bands in daily chart. Here you can see daily chart of Hive. We have seen lots of small candles in daily chart. It is the signal of consolidation. So, after completing consolidation, Hive price may continue bullish run.
Narrowing of Bollinger Bands is great signal of big moves. We may see price pump in a few weeks. I shared lots of analysis about Hive price chart and said I was waiting to see the beginning of bullish trend until end of March of the beginning of April. March has been passed. The beginning of April may be good for crypto market.
Here you can see weekly chart of Hive and the indicators and This is why I am waiting bullish move on crypto market. Fisher Indicator is on the bottom and ready to reverse up. MACD Indicators complete correction. So, we may see good moves on weekly chart of Hive price.
You can see what happened after reversing up the indicators from the bottom. Good weeks are coming soon.
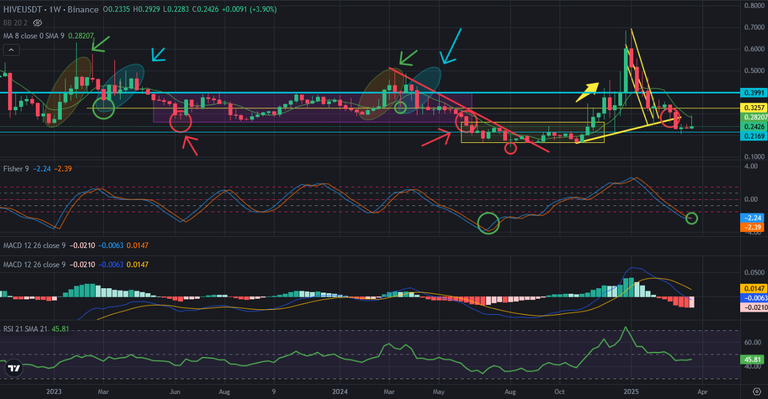
Even we can not see bullish move on Hive price and crypto market, we may see consolidation time. It may take a few weeks or months.
So, we may not see again huge drops on Hive price chart and crypto market.
We will see..
Posted Using INLEO
Congratulations @chorock! You have completed the following achievement on the Hive blockchain And have been rewarded with New badge(s)
You can view your badges on your board and compare yourself to others in the Ranking
If you no longer want to receive notifications, reply to this comment with the word
STOPCheck out our last posts: