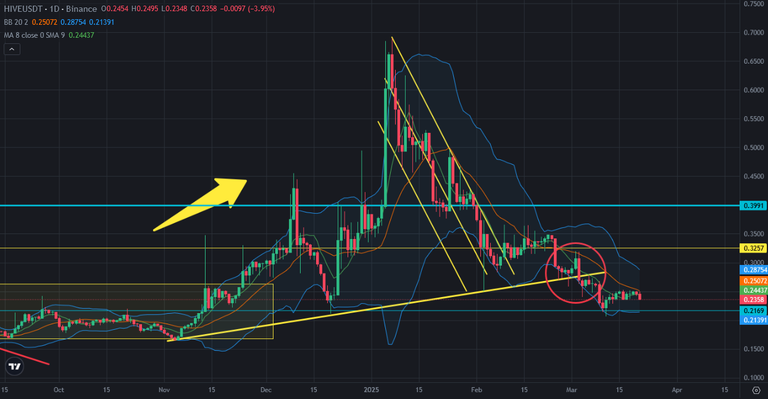
Hive Price Resisted by the Middle Line of Bollinger Bands
There is only one great resistance on Hive price chart. Hive price resisted by the middle line of Bollinger Bands in daily chart. I shared lots of analysis about Hive price chart and said, we may see reversing up until the end of March or the beginning of April. I am sure that we will see..
Here you can see daily chart of Hive. 0,26 USD is great resistance for Hive price chart. Because it the top level of depression zone and the middle line of Bollinger Bands is at 0,26 USD level.
Hive price should break up this resistance and stay above this major level.
Here you can see the indicators on daily chart of Hive. There were downtrend lines on Hive price charts indicators. They are broken up. Even they are broken up, Hive price can not go up. The middle line of Bollinger Bands resisted Hive price. Hive will break up this critical level in another try.
MACD Indicators is increasing. Great resistance on RSI Indicator is broken up. We need only time.
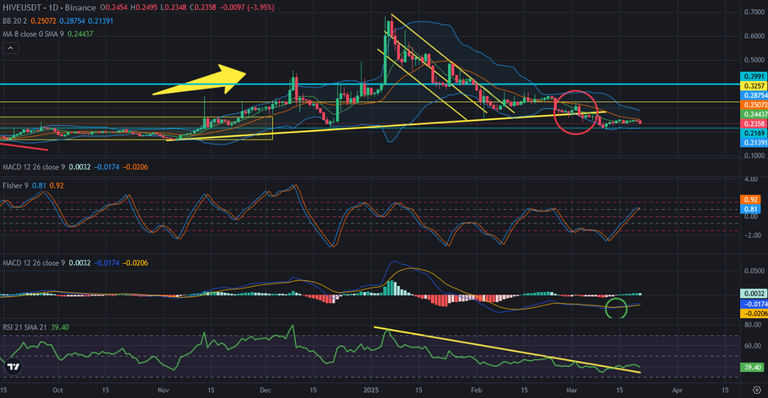
Market maker always wants to make fake moves. It may be only a fake move. There are lots of confirmation about bullish trend. We need only the see first move of Bullish trend.
We will see..
Posted Using INLEO
This post has been manually curated by @bhattg from Indiaunited community. Join us on our Discord Server.
Do you know that you can earn a passive income by delegating your Leo power to @india-leo account? We share 100 % of the curation rewards with the delegators.
100% of the rewards from this comment goes to the curator for their manual curation efforts. Please encourage the curator @bhattg by upvoting this comment and support the community by voting the posts made by @indiaunited.