Hive Price is Trying to Find the Bottom
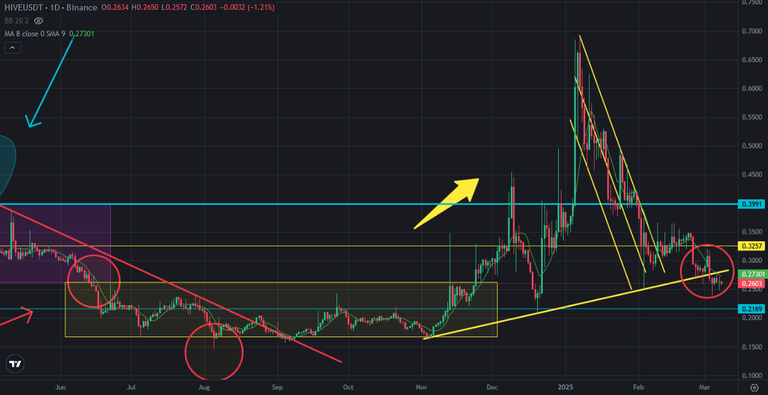
Hive is under price correction after touching 0,70 USD. Hive started so bullish this year. After market manupilation by Trump crypto market entered bearish season. Hive price went down from 0,70 USD to 0,26 USD. It is normal price correction for bullish season. 0,26 USD may be the bottom of price correction.
Here you can see daily chart of Hive. Hive price spend most of 2024 in depression zone. 0,26 USD was the top line of depression zone. Hive price should stay above this important and great support line. If it breaks down, Hive price will enter depression zone.. It may be hard to break up this zone. We have seen it before..
Here you can see the indicators on daily chart of Hive. I don't think that Hive price will enter this depression zone. Because we are in bullish season. Hive price was in depression zone in bearish season.
When we look the indicators on daily chart of Hive price, MACD and Fisher Indicators are at good level to reverse up. There is downtrend on RSI Indicator. When MACD and Fisher Indicators revereses up, RSI Indicator will start to go up..
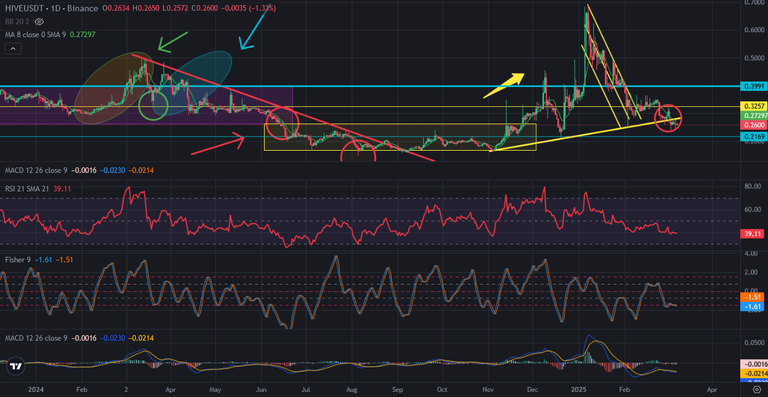
Indicators seem bullish. So, Hive price may have found the bottom. I hope It found.
We will see...
Posted Using INLEO
This post has been manually curated by @bhattg from Indiaunited community. Join us on our Discord Server.
Do you know that you can earn a passive income by delegating your Leo power to @india-leo account? We share 100 % of the curation rewards with the delegators.
100% of the rewards from this comment goes to the curator for their manual curation efforts. Please encourage the curator @bhattg by upvoting this comment and support the community by voting the posts made by @indiaunited.