Hive Price is Close to Break up Great Resistance
Hive price was in price correction after touching 0,70 USD. Due to marker condition, Hive price went down and touched 0,21 USD where is the middle line of depression zone. I shared lots of post about Hive price chart during a few years. I drew this draft and It worked as well. The top line of depression zone is at 0,26 USD and the middle line of Bollinger Bands is at 0,26 USD in daily chart.
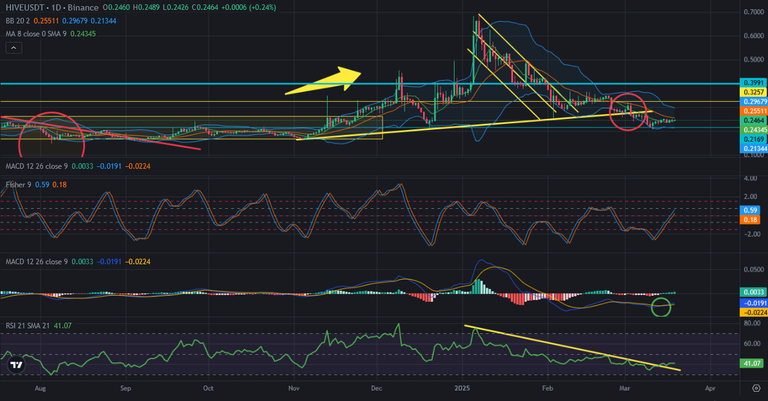
Here you can see daily chart of Hive price. You can see the importance of 0,26 USD in Hive price chart. Hive will break up this great resistance and it will enter safe zone..

Here you can see the indicators on daily chart of Hive price. This is why I say that Hive will break up 0,26 USD. Becasue Hive broke up RSI Indicator. There is downtrend line on RSI Indicator and It is broken up.
MACD Indicator is on the bottom and reversed up. When MACD Indicator enters above 0 level, we will see bullish moves on Hive price chart.
Hive goes up slowly. When market turns bullish, Hive follow from the back but it finishes as a star.
I believe that Hive will be the star of 2025 altcoin season.
We will see.
Posted Using INLEO
How far it will go ? 5$ ? 10$ ? or more..
I hope we will see all time high..
Thank you for your witness vote!
Have a !BEER on me!
To Opt-Out of my witness beer program just comment STOP below
Breaking 0.25$ and staying above will be a good achievement
This post has been manually curated by @bhattg from Indiaunited community. Join us on our Discord Server.
Do you know that you can earn a passive income by delegating your Leo power to @india-leo account? We share 100 % of the curation rewards with the delegators.
100% of the rewards from this comment goes to the curator for their manual curation efforts. Please encourage the curator @bhattg by upvoting this comment and support the community by voting the posts made by @indiaunited.