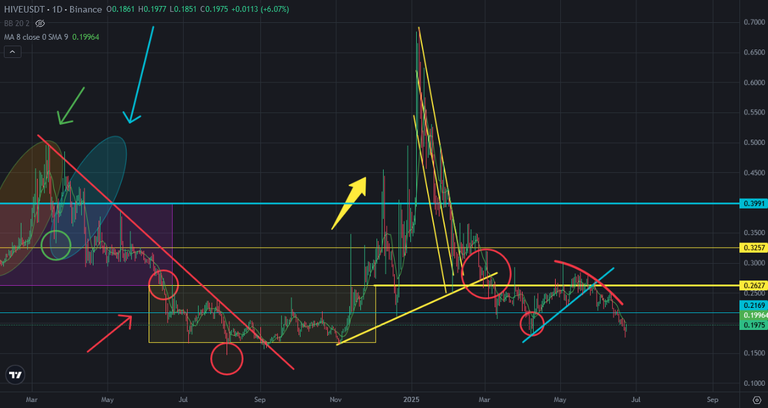
Double Bottom Pattern is on Hive Price Chart
Double bottom pattern appeared on Hive price chart after touching 0,17 USD. If Hive price reversed up we can say that It is double bottom pattern. Finally Hive price will enter new pattern after breaking down the middle line of depression zone.
Here you can see daily chart of Hive and my draft. I shared this draft a few years ago and I shows us the future as well. As my draft Hive price may be on the bottom. We did see bearish trap on Hive price chart in April. If Hive price goes on the middle line of depression zone, we can say that it is a bearish trap. Hive price should reverse up fast.
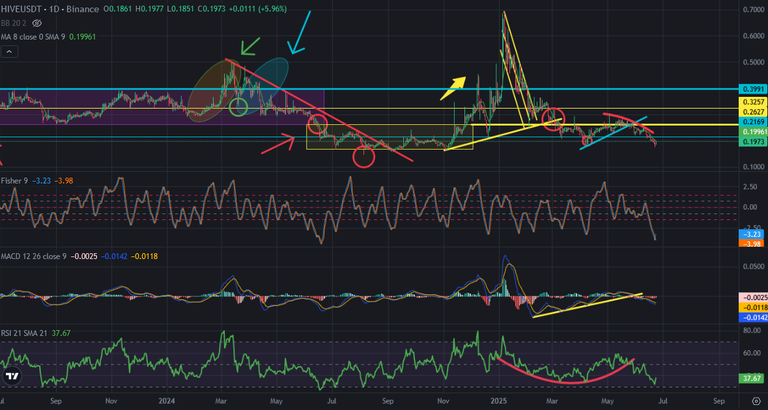
Here you can see the indicators on daily chart of Hive price. Hive price broke down all pattern in the indicators. There was mini uptrend line on MAC Indicator and It is broken down. There was bowl pattern on RSI Indicator and It is broken down.
Fisher Indicator is on the bottom and trying to reverse up. We may see fast reversing up on Hive price chart and Hive price may go above the middle line of depression zone. I hope It will happen and We will focus double bottom pattern.
As I said, it may be double bottom pattern. It may be great time to pick up discounted Hive. It is great chance to pick up discounted Hive from depression zone..
We will see.
Posted Using INLEO
This post has been manually curated by @bhattg from Indiaunited community. Join us on our Discord Server.
Do you know that you can earn a passive income by delegating your Leo power to @india-leo account? We share 100 % of the curation rewards with the delegators.
100% of the rewards from this comment goes to the curator for their manual curation efforts. Please encourage the curator @bhattg by upvoting this comment and support the community by voting the posts made by @indiaunited.
Which is the double bottom pattern here?
I certainly hope it is!