Bullish Trap Appeared on Bitcoin Price Chart While Trying to Break up Great Resistance
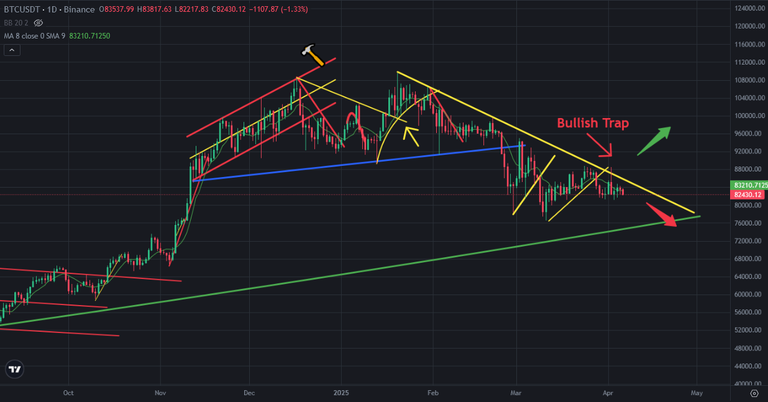
There was a grea resistance on Bitcoin price chart coming from 108K. Bitcoin is trying to break up this great resistance and It is tested 4 times before. Even Bitcoin broke up this great resistance 3 days ago, it wa on ly for a bullish trap. Bitcoin price went down below this resistance again.
Here you can see daily chart of Bitcoin. Bullish traps appeared on Bitcoin price chart. Market maker always does fake moves. This is the first fake moves on Bitcoin after going down from 108K.
After bullish trap on Bitcoin price chart, Bitcoin price may go down a little bit.
Here you can see 3-day chart of Bitcoin price. This is why Bitcoin price may go down a little bit. MACD Indicators is close to reverse up. Even Fisher Indicator is going up, Bitcoin price can not follow it. There is downtrend line on RSI Indicator.
If Bitcoin price gets huge green 3-day candle, we may see reversing up on the indicators. You can see what happened after reversing up or down on MACD Indicator. It is great signal for mid-term.
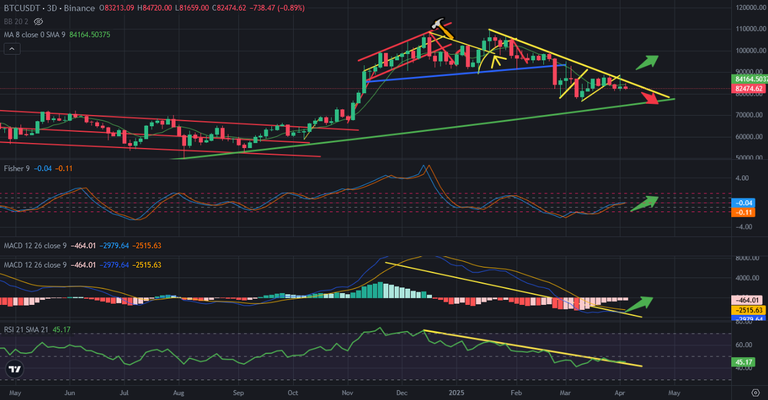
So, even we may get price dump on Bitcoin price chart, good days are coming. Weekly chart of Bitcoin price started to appear completed the correction.
We will see...
Posted Using INLEO
Congratulations @chorock! You have completed the following achievement on the Hive blockchain And have been rewarded with New badge(s)
You can view your badges on your board and compare yourself to others in the Ranking
If you no longer want to receive notifications, reply to this comment with the word
STOPCheck out our last posts: