Bullish Doji Star Candle Appeared on Weekly Bitcoin Price Chart
After Black Monday on market, all of crypto and stock market opened the new week with red candle. After panic, all of market reversed up. It is important for see this move at the beginning of week. Because bullish doji star candles appeared on weekly Bitcoin price chart after this move. It is great signal of reversing up.
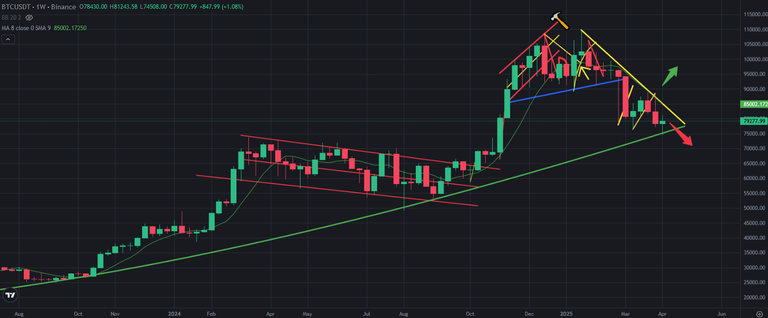
Here you can see weekly chart of Bitcoin. Bitcoin price stucked between great downtrend line and great uptrend line. We will see breaking up or down in a few weeks. Before breaking up or down on Bitcoin price chart, it was great to see bullish doji star candle on weekly chart of Bitcoin. We added new bullish signal in our wallet.
Here you can see the indicators on weekly chart of Bitcoin. MACD Indicators is trying to reverse up. If we close this week in this level, MACD Indicator will start to reverse up. Fisher Indicator is on the bottom has no decision to go up. We need only a few weeks for Fisher Indicator.
There was great support line on RSI Indicator. It was broken down at the beginning of the week. After doji candle, we may see going up on RSI support line.

If we don't see the new FUD or market crash, Bitcoin price will start to reverse up.
We will see...
Posted Using INLEO
It will most likely be up from here!
But ultimately it all depends on all the intense, global "rewiring" behind the scenes... The whole Western "deep state" system is at the very least losing a lot of power, best case it might even be breaking up for real!
Bitcoin and other new tech then will "rewire" everything as we go...
I do suspect that the US will actually do great, but that will be at the cost of Europe, which has no viable way forward to even survive other than at the very least kill off the EU!