Bowl Patterns are on Bitcoin Price Chart
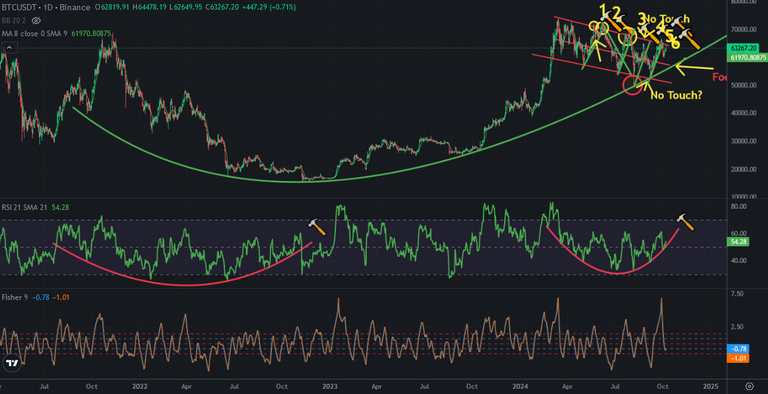
There are bowl patterns are on Bitcoin price chart. These pattersn are on both price and RSI Indicator. Here you can see daily chart of Bitcoin. I drew the similarity between past and now and You can see what happened after bowl pattern breaking down. Bitcoin price is close to break down RSI Indicators bowl pattern. If it breaks down, we may see the touch on price bowl pattern which is at 57K USD level.
2024 United States presidential election may be the date of touching bowl pattern. I shared a post about this thesis. When we focus on RSI Indicators pattern we can see price dump when it breaks down. We saw the bottom level about 16K when bowl pattern broken down in 2022. We may see same scenario when RSI Indicator breaks down bowl pattern. It may be great opportunity to pick up cryptos.
2024 United States presidential election is important for crypto market.ç It may be the trgigger to enter bullish trend.
Today Bitcoin price tested to break up the top line of descending channel and It went down. I think we will not see all time high until 2024 United States presidential election. I also focus on the date of this election and possible price level at this date..
It is hard to see breaking down on the prices bowl pattern..
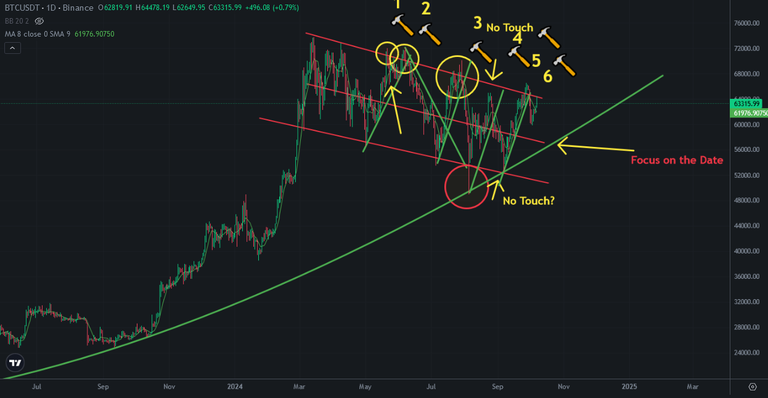
I am following RSI Indicator to see possible breaking down on bowl pattern. When it happens, Bitcoin price will enter new pattern that may be mega bullish season..
We will see..
Posted Using InLeo Alpha
Still waiting.....for 57k, is that going to happen ?
Yes. I am still waiting 57K. Just follow bowl pattern on RSI Indicator.
RSI Indicator broke down uptrend line on 4-hour chart. Downtrend may continue..
I only missed short-term trade for long. I did not buy anything when BTC touched 61K...
Just follow daily close below 61.7K USD..
Still did not understand, may be a little more details ?
If you see daily close below 61.7K, be ready for 57K...
It started…