Bitcoin Touched Great Resistance - We Should be Careful!
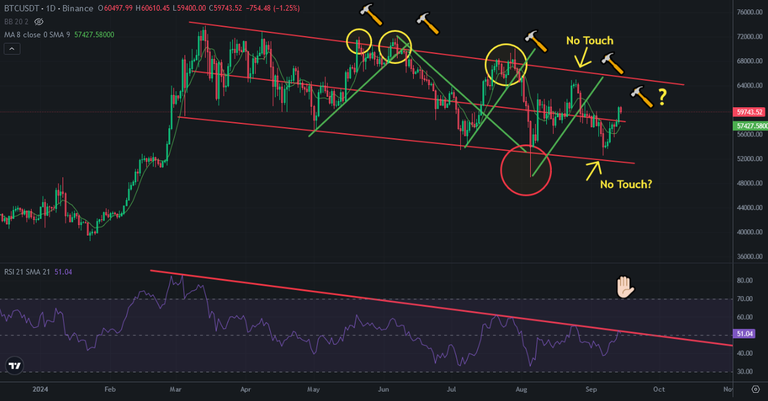
Yesterday Bitcoin closed daily candle on the top and RSI Indicator touched great resistance. I shared a few analysis about this great resistance. Bitcoin tried to break up this resistance 3 times before and It could not break up. This may be 4th time that It may be resisted.
Here you can see daily chart of Bitcoin and RSI Indicator. RSI Indicator resisted by great downtrend line. We may see price drop after touchin this resistance. Even there is no resistance on price chart, we should be careful. RSI Indicator is more important than price!
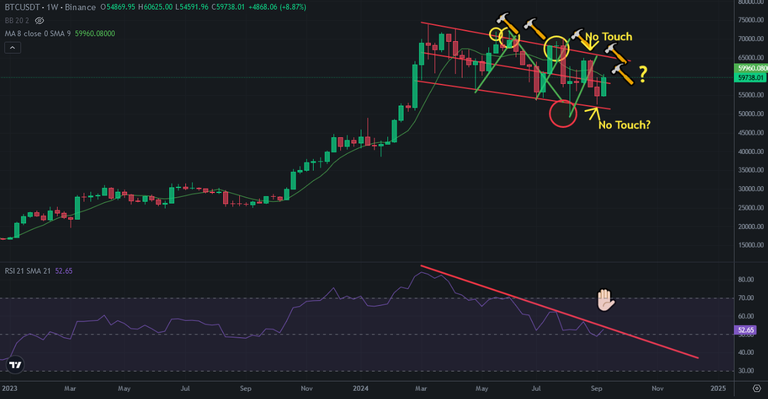
Here you can see weekly chart of Bitcoin. RSI Indicator also touched great resistance in weekly chart. We may be red weekly candle on Bitcoin price chart in next week. We may see a downtrend again.. If not, Bitcoin price will enter bullish trend. I think It may be early.
We are at critical level. Next week will be very important. FED meeting is also coming soon. This is why Indicator are waiting for new pattern.
I think we may see a downtrend again. If not, we should be all in market. Because, Bitcoin price will break up 100K.
I will follow Bitcoin price daily.. We will see..
Posted Using InLeo Alpha