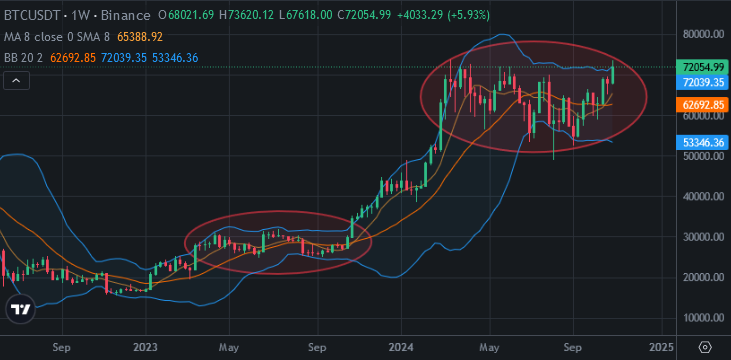
Bitcoin Price Touched the Top Line of Weekly Bollinger Bands as 2023
Bitcoin price touched the top line of weekly chart of Bitcoin as end of 2023. There is a similartiy between end of 2023 and 2024. Here you can see weekly chart of Bitcoin and you can see what happaned at the end of 2023. You can see what happened after touching the top line of Bollinger Bands in weekly chart.
The top line of Bollinger Bands seemed as stable during this year. After touching the top line, it started to increase.. It means, we may see bullish weeks after this touch. Bitcoin price may go up during touching this top line..
Here you can see the indicators on weekly chart of Bitcoin. I drew the similarities between end of 2023 and now. Fisher and MACD Indicators are at the same level and going up. RSI Indicator at the lower level. It is good for bullish scenario. RSI Indicator has moe potential than 2023. Bitcoin price went up more than 40K USD after this touch in 2023. Bitcoin price went up more than 120% after this touch. So, Bitcoin may touch 110K or 160K if this scenario happens..
I think that Bitcoin will enter mega bullish trend after 2024 US Election. This is one of bullish similarty between past and now.
We will see..
Posted Using InLeo Alpha

