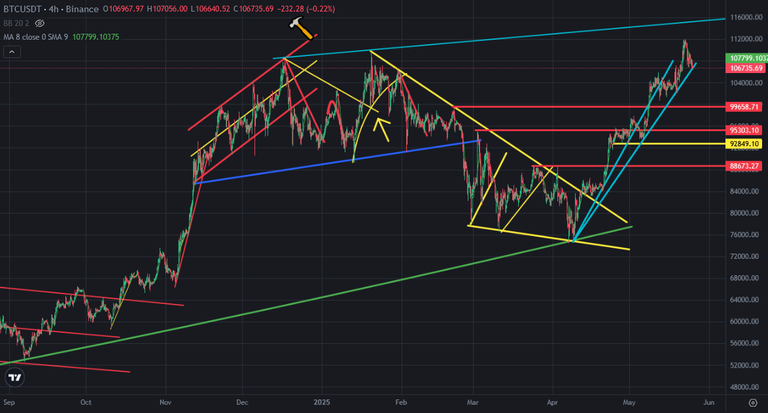
Bitcoin Price Touched Mini Uptrend Line After All Time High
It is the first time of touching mini uptrend line after all time high. Even Bitcoin price touched all time high, there is no hype on market and price correction is coming soon for Bitcoin price chart. Bitcoin price went up without any price correction from 76K to 112K USD.
Here you can see daily chart of Bitcoin. This is the second mini uptrend line coming from 76K. After breaking down the first mini uptrend line, we have not seen so much price dump on Bitcoin price chart. We may see huge price dump after breaking down this second mini uptrend line.
Here you can see the indicators on daily chart of Bitcoin. This is why I am waiting price dump after breaking down the mini uptrend line. Fisher Indicator reversed down from the top. MACD Indicator reversed down from the top. After getting a red daily candle, major indicators reversed from the top.
There was great bowl pattern on RSI Indicator. It is broken down. We will enter new patter after completing bowl pattern.

Possible price correction on Bitcoin price chart is coming soon. This week was 7th green week for Bitcoin price chart. We will follow weekly close for this week. Red weekly candles are coming soon.
We will see..
Posted Using INLEO
Congratulations @chorock! You have completed the following achievement on the Hive blockchain And have been rewarded with New badge(s)
You can view your badges on your board and compare yourself to others in the Ranking
If you no longer want to receive notifications, reply to this comment with the word
STOPIndeed, the steady rise from $76,000 to $112,000 without a big correction makes a strong correction very likely.