Bitcoin Price Touched Great Support Line of Bowl Pattern
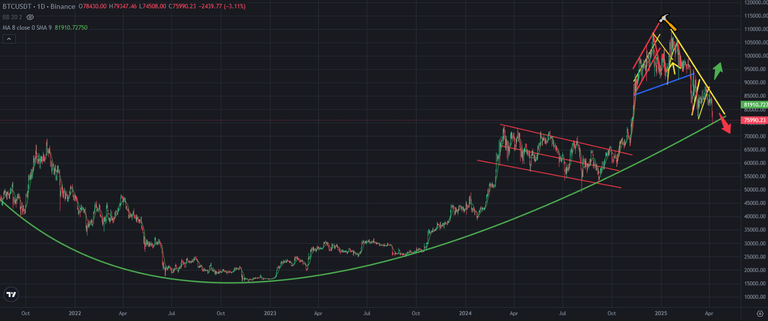
There was great support line on Bitcoin price chart coming from end of 2021. There is great bowl pattern on Bitcoin price chart. After market crash, Bitcoin price touched this great support line today. Will it break down?
Here you can see daily chart of Bitcoin. If Bitcoin price breaks down this great support line, we may see huge drops on market. We may see the end of crypto market. It is very hard to predict the price target after breaking down this great support line. Bitcoin price is in bowl pattern.
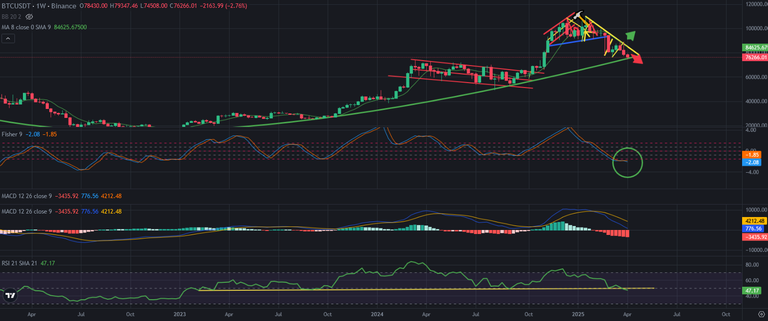
Here you can see weekly chart of Bitcoin and the indicators. MACD Indicators is going down. Even Fisher Indicator is on the bottom, it may continue to go down.
There was great support line on RSI Indicator. It is broken down after weekly close on yesterday. It should be a bearish trap! If not, Bitcoin price may break down great bowl pattern. If it happens, we may see huge drops. It may be only the beginning..
We are at cricitical level for Bitcoin price chart. Price drop should end. If not, we will enter the new trend of price drop.
As I said, we are in critical moment for crypto and stock market.
I hope bowl pattern will support Bitcoin price chart.
We will see..
Posted Using INLEO
That is a new take, thanks!
There will be a lag of a few weeks or so before the fiat printing really starts, Bitcoin need to survive that of course...
Will we get a 2020 crash & v-shaped recovery? Maybe...
I remember well the mental climate at the beginning of the GFC in 08, if/when that returns I will see how Bitcoin handles that...
Back then I bailed to the deserted villages of Aragon in Northern Spain, with what cash I could muster, just being away from it all was a great choice 🙂
Now of course it makes a lot of sense to keep producing content here & elsewhere that supports freedom and micropayments!