Bitcoin Price Should Reverse Up When Looking Weekly Chart
Bitcoin price chart started to appear bullish on weekly chart. We may be close to reversing up. I shared a few analysis about Bitcoin price chart and said we may reverse up until end of March or the beginning of April.
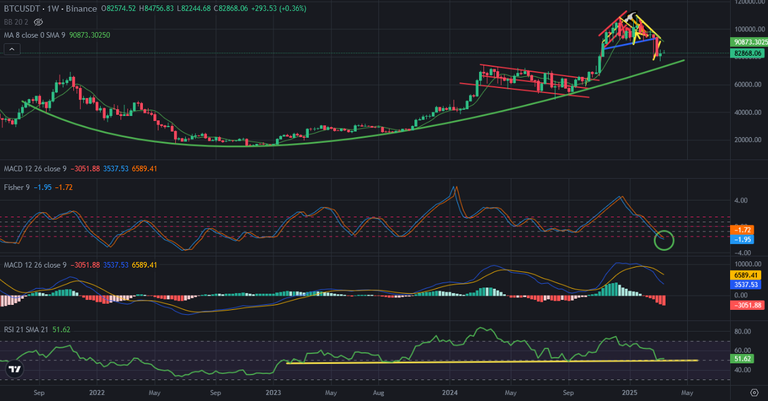
Here you can see weekly chart of Bitcoin and major indicators below. All of major indicators are close to reversing up. We need only a few weeks to see reversing up. This is why I say that we may see reversing up until the end of March or the beginning of April.
There is great support line on RSI Indicator. This is why I say that we are close to the bottom. It may be hard to break down this great support line. Being on this great support line is the signal of being bullish trend. Bitcoin is above this great support line since the beginning of 2023..
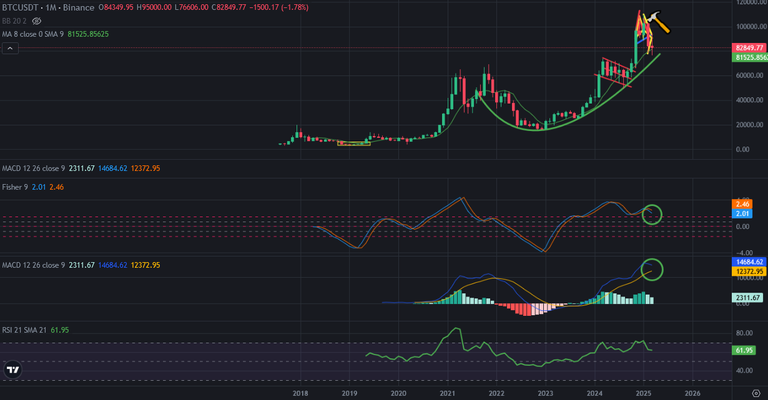
Here you can see monthly chart of Bitcoin. Fisher Indicator reversed down. MACD Indicator is close to reverse down. So, Bitcoin price should go up for not to reverse down on MACD Indicator. If it reverses down, you can see what will happen when looking the chart.
So, April should be green for Bitcoin price chart.
I am waiting for price reversing up in a few weeks. After reversing, I will focus price target.
We will see..
Posted Using INLEO
Lets hope you right. If I understand correctly there are some big players shorting BTC pretty hard right now.