Bitcoin Price Retested Great Resistance as a Support
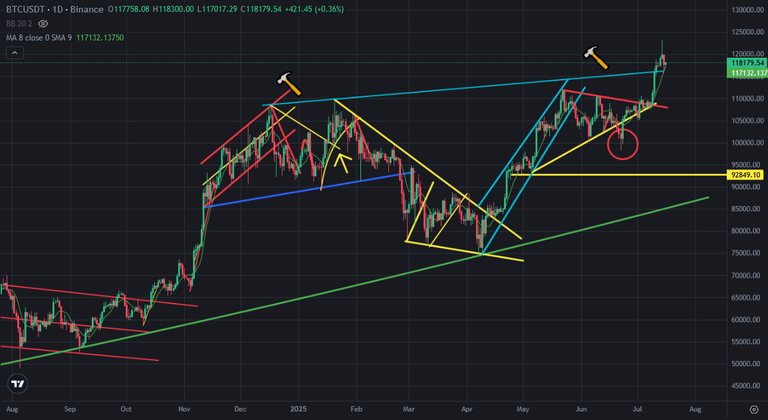
There was great resistance on Bitcoin price chart during this year. It was coming from old all time high levels. It is tested 3 times to break up before. Finally It is broken up in this week. After breaking up this resistance, Bitcoin price went up to 122K USD.
Here you can see daily chart of Bitcoin. After touching 122K USD, Bitcoin price reversed down to touch old resistance as a support. Yesterday Bitcoin price went down to 116K and touched this resistance as a support. It is normally a bullish move.
Here you can see the indicators on daily chart of Bitcoin price. Fisher Indicators is on the top and reversed down. MACD Indicator is going up. There is great resistance on MACD Indicator. It will touch this resistance in a few days. It may be hard to break up this resistance.
If Bitcoin price reversed down from this level after tıuching the resistane, there will be a negative divergence on RSI Indicator. We may see price correction after this divergence..
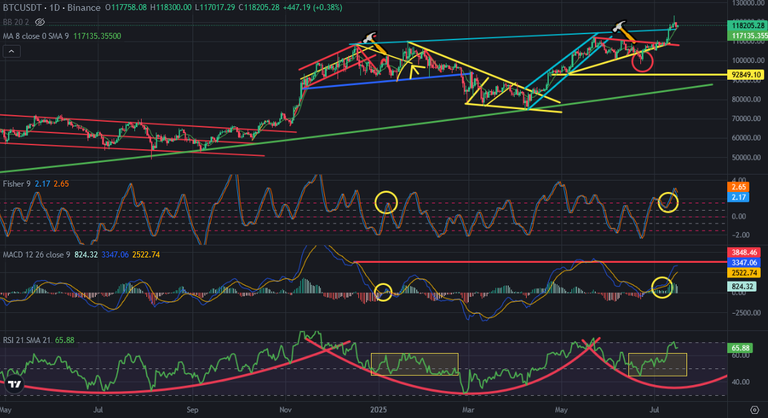
Even there are resistances on Bitcoin price chart, It is going up while breaking up them. We may see price correction on crypto market at the end of this month.
We will see..
Posted Using INLEO