Bitcoin Price Reached All Time High Level After Breaking Up the Resistances
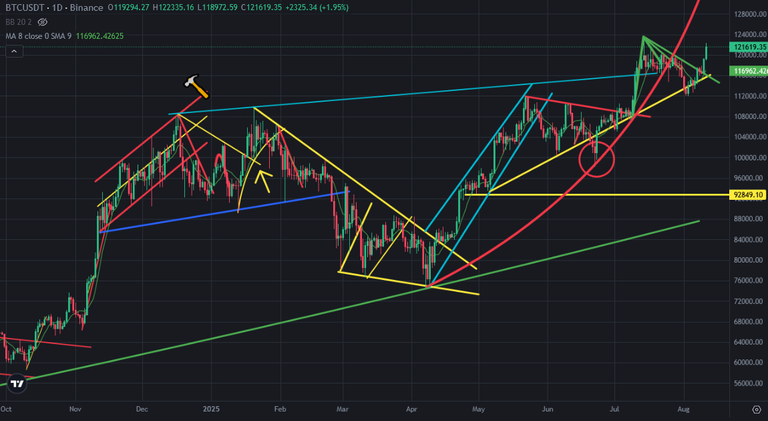
There were downtrend lines on Bitcoin price chart coming from all time high level. Bitcoin price broke up these downtrend lines step by step. After breaking up 3rd one, Bitcoin price went up fast with huge daily candles and reached all time high level again.
Here you can see daily chart of Bitcoin price. I drew this draft a few weeks ago. I showed you downtrend line. You can see what happened after breaking up downtrend lines. There was great resistance on Bitcoin price chart coming from all time high levels. After breaking up this resistance, It changed as support. After breaking up this support, it changed as a resitance again. Bitcoin price is above this resistance again. It is safe level for future of Bitcoin price chart.
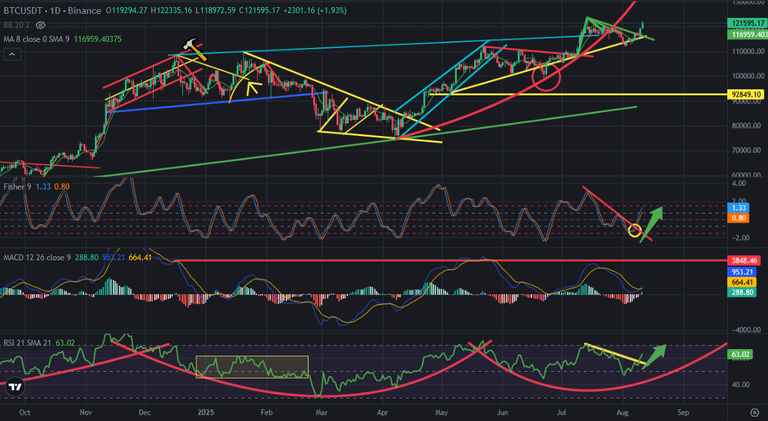
Here you can see the indicators on daily chart of Bitcoin price. There was downtrend lines on the indicators. Firstly, Fisher Indicator broke up mini downtrend line. There was great downtrend line on RSI Indicator and It is broken up. MACD Indicator was trying to reverse up and It reversed.
These are bullish signals on the indicators. Bitcoin price should break up all time high level to update. We will see the new highs on Bitcoin price chart.
There is only one resistance on Bitcoin price chart. It is all time high level. After breaking up this levels, we will see the new future.
We will see..
Posted Using INLEO
This post has been manually curated by @bhattg from Indiaunited community. Join us on our Discord Server.
Do you know that you can earn a passive income by delegating your Leo power to @india-leo account? We share 100 % of the curation rewards with the delegators.
100% of the rewards from this comment goes to the curator for their manual curation efforts. Please encourage the curator @bhattg by upvoting this comment and support the community by voting the posts made by @indiaunited.