Bitcoin Price may be Getting Ready for Bullish Trap
There was great downtrend line on Bitcoin price chart coming from 108K. Bitcoin price broke up this great downtrend line a few days ago. Even Bitcoin price broke up great resistance, we have not seen enough price pump. It may be a bullish trap.
Here you can see daily chart of Bitcoin price. We have seen lots of bullish and bearish traps on Bitcoin price chart. Market maker likes making fake moves. It may be an another fake move on Bitcoin price chart. We may meet with bullish trap in a few days.
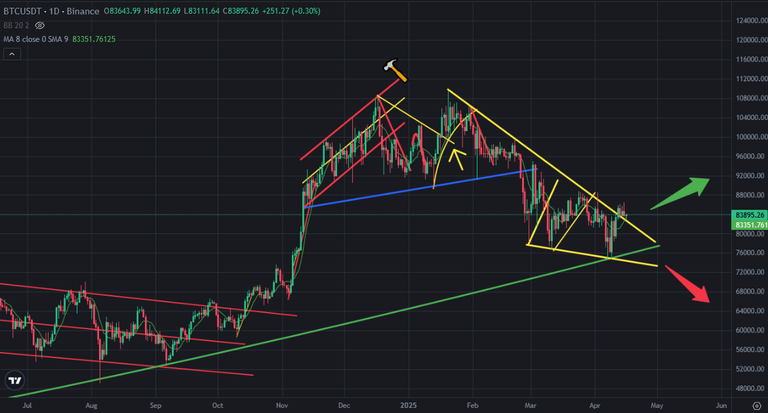
If a price is not going up, it will go down. Bitcoin price is not going up despite breaking the resistance. We are likely to see a price drop.
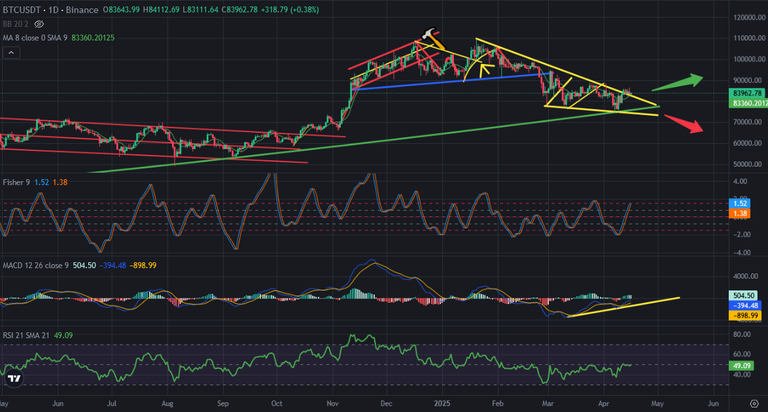
Here you can see the indicators on daily chart of Bitcoin. These indicators support my thesis. Fisher Indicator is on the top and trying to reverse down. There is uptrend line on MACD Indicator. If Fisher indicator reverses down, we may see breaking down on MACD Indicator. That will support my thesis and Bitcoin price may go down downtrend line again. It will be a perfect bullish trap for market maker.
As I said If a price is not going up, it will go down. Bitcoin price can not go up. We may see price dump on Bitcoin price chart.
We will see..
Posted Using INLEO