Bitcoin Price is Trying to Stay Above Mini Uptrend Line
There is mini uptrend line on Bitcoin price chart. Bitcoin is trying to stay above this line. It is important. Because you can see what happened after breaking down mini downtrend line before.
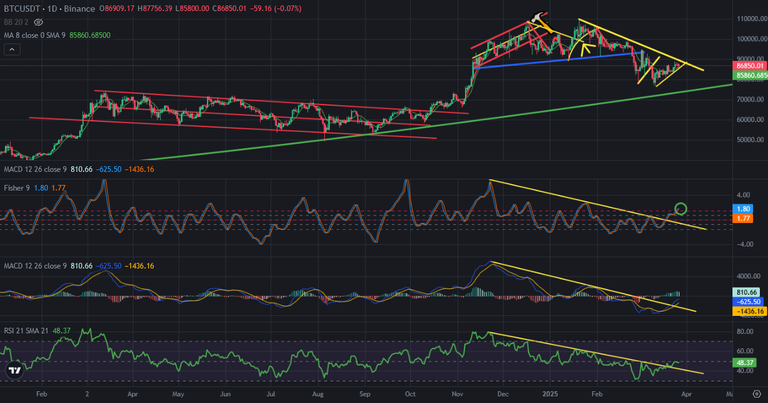
Here you can see daily chart of Bitcoin. There is also great downtrend line coming from 108K USD. Mini uptrend and great downtrend line will be crossed in a few days. Bitcoin price may not break great downtrend line in this try.

Here you can see the indicators on daily chart of Bitcoin. All of major indicators broke up downtrend lines. Even they broke up the resistances, We have not seen big price moves on Bitcoin price chart.
Fisher Indicators is on the top and may reverse down in a few days. If it reverses down, Bitcoin price will break down mini uptrend line.
I shared lots of analysis about Bitcoin price chart and said I was waiting for bullish trend until the end of March or the beginning of April. I am sure that we will see good days. There is mega uptrend line on Bitcoin price chart. If Bitcoin price goes down again after breaking down mini uptrend line, 80K is great support level for Bitcoin price.
So, we may be close to the bottom. Breaking up great downtrend line will be the trigger for bullish move on Bitcoin price chart.
I hope we will see it in a fee weeks.
We will see..
Posted Using INLEO