Bitcoin Price is Trying to Stay Above 8-Day Moving Average
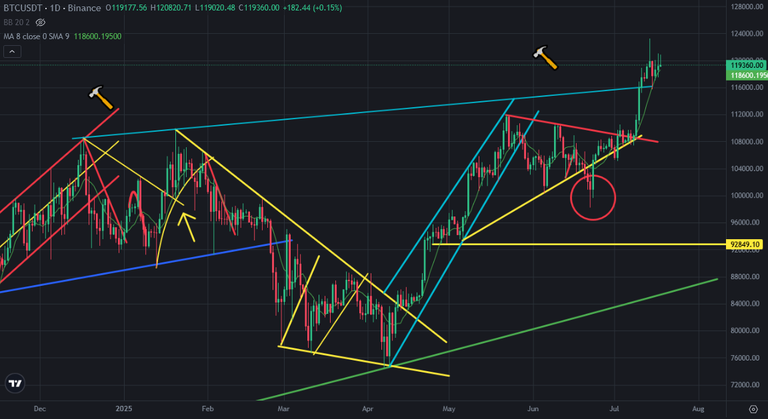
After touching 112K all time high level Bitcoin price entered price correction. While it is trying to complete price correction, it is also trying to stay above 8-day moving average. It is trend signal average. So, Bitcoin price is trying to be in bullish trend.
Here you can see daily chart of Bitcoin price. after reversing from 122K, Bitcoin price supported by 8-day moving average. This is 3rd day of toucjing this average. You can see what happened after breaking down this average.
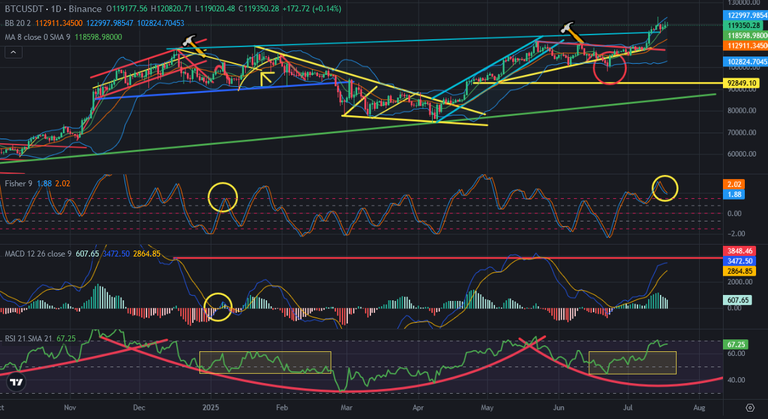
Here you can see the indicators on daily chart of Bitcoin price. MACD Indicator is going up slowly. It will touch the resistance at the end of this week. We mnay see reversing down on MACD Indicator after toucjing this resistance. Fisher Indicator is on the top and trying to reverse up again. If it reverses up it may be the last bull run on this trend.
RSI Indicator is close to over bought level. It may reverse down from this level. If it reverses down, we may see negative divergence on RSI Indicator.
So, we are going slowly to the end of mini bullish trend. We may see price correction at the end of this month. When we see daily close below 8-day moving average on Bitcoin price chart, we can say the it is the beginning of price correction.
We will see..
Posted Using INLEO
I think Bitcoin is going to break through, no fuzzing, before the year runs out, it's going to get above 150k
This post has been manually curated by @bhattg from Indiaunited community. Join us on our Discord Server.
Do you know that you can earn a passive income by delegating your Leo power to @india-leo account? We share 100 % of the curation rewards with the delegators.
100% of the rewards from this comment goes to the curator for their manual curation efforts. Please encourage the curator @bhattg by upvoting this comment and support the community by voting the posts made by @indiaunited.