Bitcoin Price is Trying to Stay Above 100-Day Moving Average
Even Crypto Market got good new by Powell, Bitcoin price can not break up all time high. Even interest rates will decrease, Bitcoin price is going down after making bullish trap. Bitcoin price reversed down after reaching 117K with good news dropped crypto market. It is trying to stay above -day moving average.
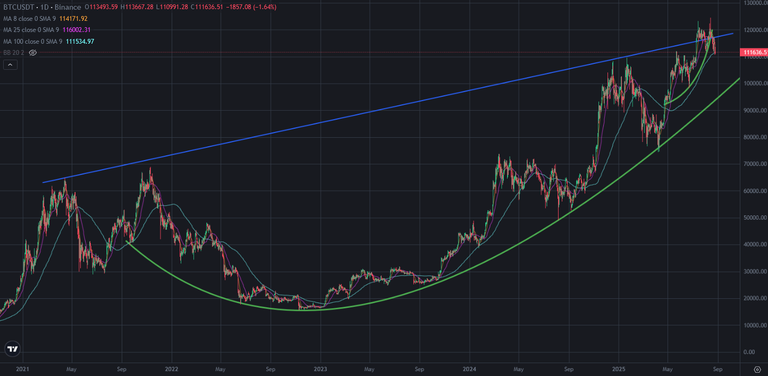
Here you can see daily chart of Bitcoin price. You can see how it has importance for trend. You can see what happened after breaking down this average. It is important to see midterm trend. We may see huge price drops on crypto and Bitcoin price chart if it breaks down.
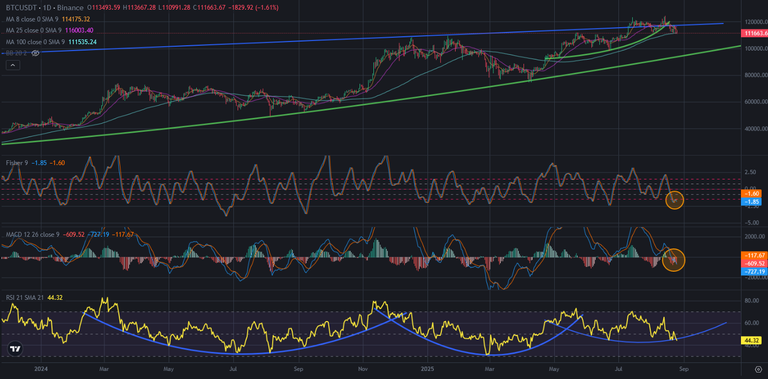
Here you can see the indicators on daily chart of Bitcoin price. There is great bowl pattern on RSI Indicator. If Bitcoin price breaks down 100-day moving average, it will break down this great bowl pattern. MACD Indicator was trying to reverse up but it could not. Fisher Indicator reversed down again from the bottom.
So, we may see another bearish attack on Bitcoin price chart. If it happens, we will see breaking down on 100-day moving average and We will see breaking down on great bowl pattern on RSI Indicator.
So, we have entered important days. Volatility on Bitcoin price chart increased. We may see higher volality on crypto market.
If we see breaking down on 100-day moving average, we should be careful.
We will see..
Posted Using INLEO
Can't wait to see what the future holds
Nice work with the post
This post has been manually curated by @bhattg from Indiaunited community. Join us on our Discord Server.
Do you know that you can earn a passive income by delegating your Leo power to @india-leo account? We share 100 % of the curation rewards with the delegators.
100% of the rewards from this comment goes to the curator for their manual curation efforts. Please encourage the curator @bhattg by upvoting this comment and support the community by voting the posts made by @indiaunited.