Bitcoin Price is Close to Touch Downtren Line
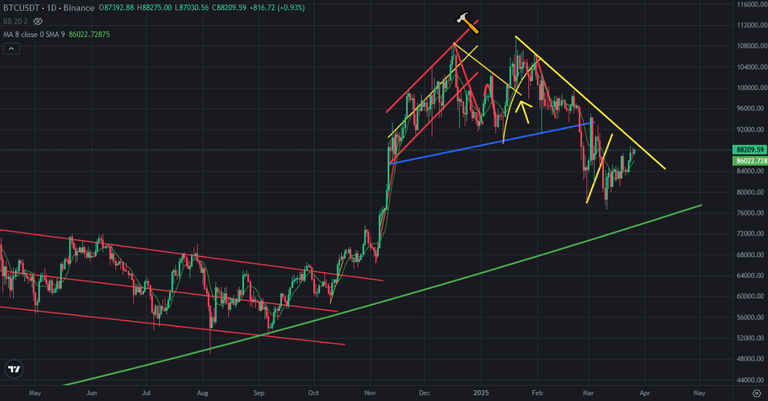
Bitcoin price is going up slowly after touching 7xK USD. There is great resistance on Bitcoin price chart coming from 108K USD. Bitcoin price may touch this resistance in a few days. Will it break up?
Here you can see daily chart of Bitcoin. It is tested 3 times before. If Bitcoin price breaks up this great resistance we may see huge price moves on Bitcoin price chart.
If not, there is great support line on Bitcoin price chart. Bitcoin price may go down to touch this great support line..
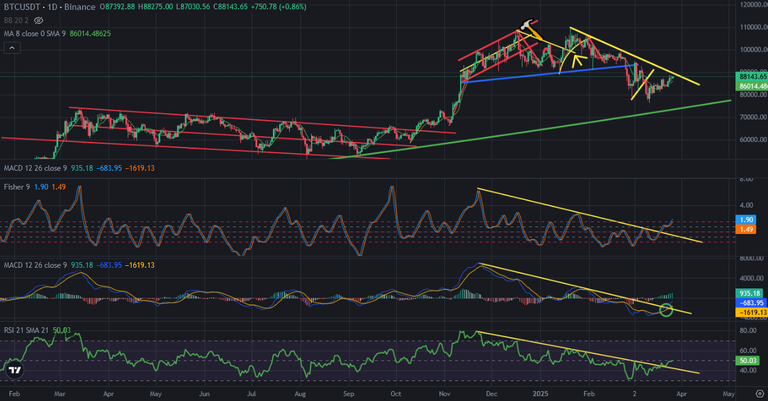
Here you can see the indicators on daily chart of Bitcoin. There are lots of downtrend lines on the indicators. They are broken up. RSI, MACD and Fisher Indicators broke up resistances.
So, we are waiting for breaking up on Bitcoin price chart.
Fisher Indicator is on the top and may reverse down in a few days. So, Bitcoin should bu quick to break up downtrend line. If not, Fisher Indicator will reverse down in a few days..
Even Bitcoin price chart is going up slowy, It may break up great downtrend line. If not, don't worry. It will break up this downtrend line in a few weeks.
I shared lots of analysis about Bitcoin price chart and said, we may see bullish trend on Bitcoin price chart until the end of March or the beginning of April.
We will see..
Posted Using INLEO