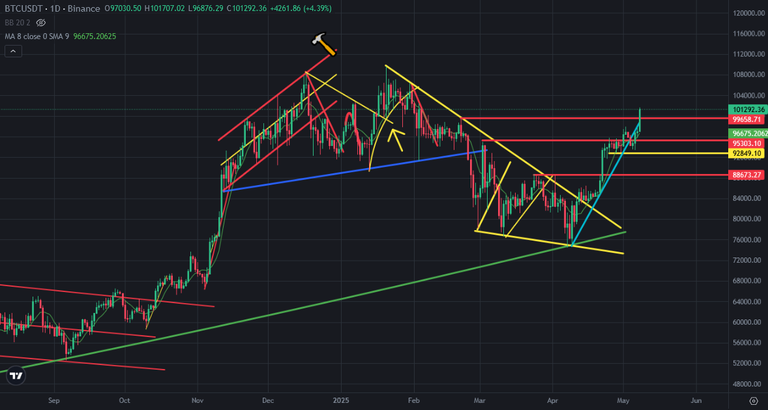
Bitcoin Price Cleared all Resistances
Bitcoin price broke up all resistance step by step after touching and reversing from 76K USD. Yesterday Bitcoin price touched mini uptrend line coming from 76K USD, It thought that I might reverse down from this level. It may be retest of reversing. But Today Bitcoin price got huge green candle.
Here you can see daily chart of Bitcoin and the resistances. Bitcoin price broke all the resistances after touching 76K. There was great support line on 76K. After touching to be supported this support line, Bitcoin price went up fast and destroyed all resistances.
Here you can see the indicators on daily chart of Bitcoin. MACD Indicator made a fake move and it reversed up again. I was waiting for reversing down on MACD Indicator but It reveresed up again.
There is huge bowl pattern on RSI Indicator. RSI Indicator is too high from support line. It should touch this support line.
Fisher Indicator reversed up from the bottom. We may see uptrend on Bitcoin price chart for a few days.

We may see all time high in this month. ''Sell in May, go away'' motto is still on the table. We will see selling trend on this month.
We will see...
Posted Using INLEO
Thank you for your witness vote!
Have a !BEER on me!
To Opt-Out of my witness beer program just comment STOP below
View or trade
BEER.Hey @chorock, here is a little bit of
BEERfrom @isnochys for you. Enjoy it!Learn how to earn FREE BEER each day by staking your
BEER.View or trade
BEER.Hey @chorock, here is a little bit of
BEERfrom @isnochys for you. Enjoy it!Learn how to earn FREE BEER each day by staking your
BEER.Bitcoin finally hit over 100k price. I hope it sustains its momentum for a longer period of it time. But unfortunately, it might not stay that long.
Brother, please provide more technical analysis of hive. I follow your content every day 🥹