Bitcoin Price Broke Up Downtrend Line Coming From All Time High
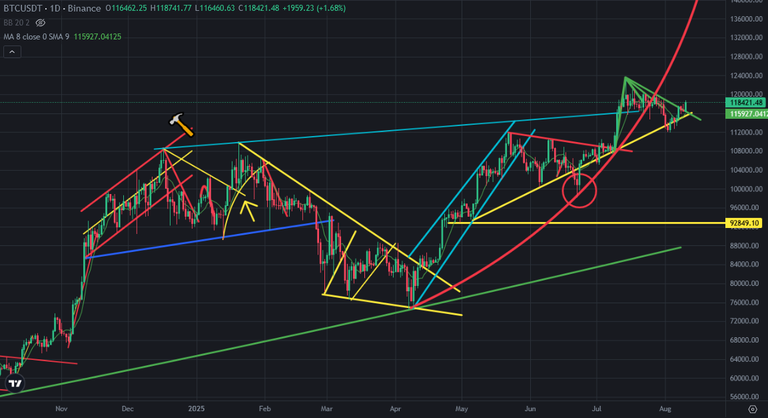
There were downtrend lines on Bitcoin price chart. Bitcoin price broke up broke up these downtrend lines. It was the third one of these downtrend lines. Bitcoin price broke up this downtrend line today.
Here you can see daily chart of Bitcoin price. Bitcoin price supported by mini uptrend line. Big crossing was coming soon and It happened. Bitcoin price choosed to break up downtrend line.
After breaking up this downtrend line Bitcoin price got big daily candle. It may be possible to see more green candles on Bitcoin price chart.
Here you can see the indicators on daily chart of Bitcoin price. There was downtrend line on RSI Indicator. It was so important resistance on Bitcoin price chart and It is broken up today. If Bitcoin price closes the day above this level, we will see breaking up on RSI Indicators resistance and Bitcoin price may go up more.
MACD Indicator is trying to reverse up. We will see another bullrun when MACD Indicator reverses up. Fisher Indicator reversed up yet. All indicators appear good for bullish run.
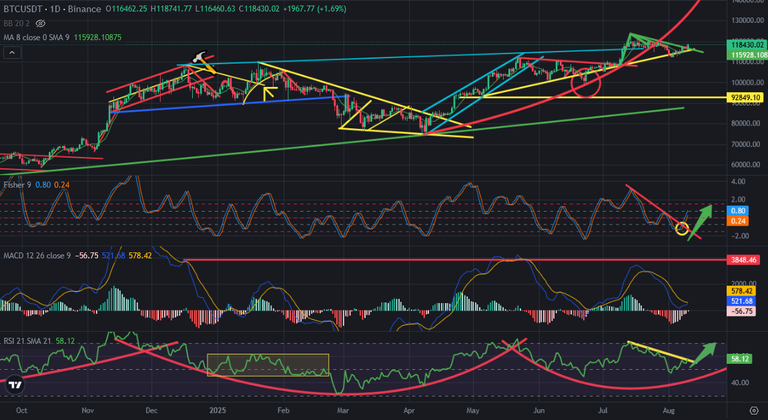
It may be possible to see all time high again in Bitcoin price chart. Resistances are broken up. Bitcoin price is ready for new bull run.
We will see..
Posted Using INLEO
This post has been manually curated by @bhattg from Indiaunited community. Join us on our Discord Server.
Do you know that you can earn a passive income by delegating your Leo power to @india-leo account? We share 100 % of the curation rewards with the delegators.
100% of the rewards from this comment goes to the curator for their manual curation efforts. Please encourage the curator @bhattg by upvoting this comment and support the community by voting the posts made by @indiaunited.
Bitcoin has broken the downtrend for the third time, this is very good, we hope to see a bullish moment ahead. Very nice analysis.