Bitcoin Price Broke Down Mini Uptrend Line
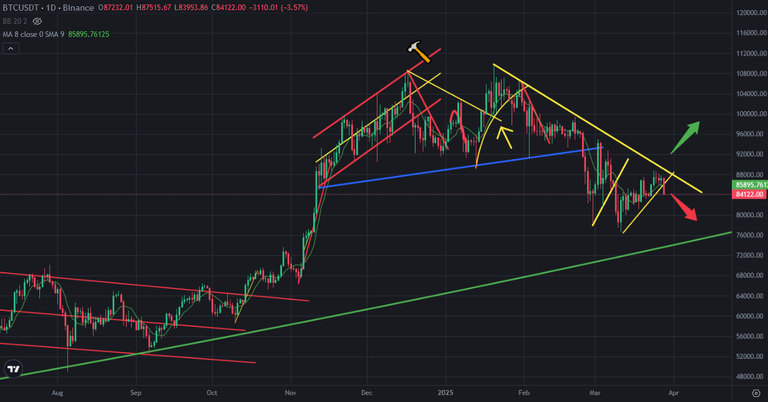
Bitcoin price resisted by great downtrend line coming from 108K USD. There were mini uptrend lines on Bitcoin price chart. I shared an analysis about Bitcoin price chart and showed you these mini uptrend lines. Today Bitcoin price broke down the last mini uptrend line.
Here you can see daily chart of Bitcoin. There is great support line on Bitcoin price chart and It is ready to support Bitcoin price for worst scenario. We may see price drops after breaking down mini uptrend line.
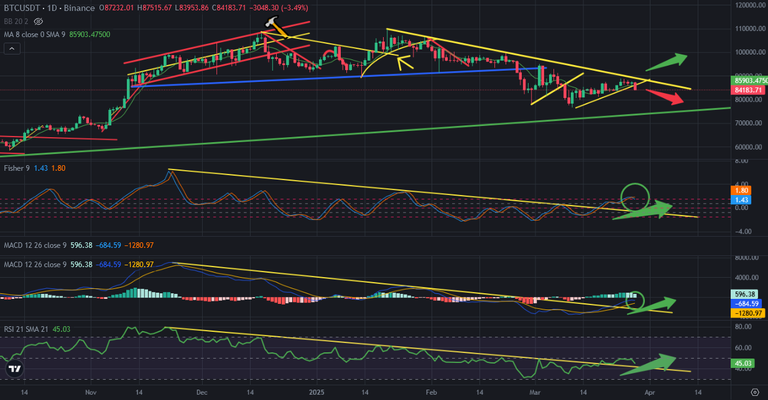
Here you can see the indicators on daily chart of Bitcoin. Even all of downtrend lines of the indicators are broken up, we have not see enough price pump on Bitcoin price chart. Because there was great downtrend line on Bitcoin price chart.
Due to being under resistance of great downtrend line, the indicators started to appear bearish. We may see mini bearish trend after breaking down mini uptrend line. Fisher Indicators reversed from the top. MACD Indicators may reverse down again. If this scenario happens, we may see mini bearish trend on Bitcoin price chart.
I shared lots of analysis about Bitcoin price chart and said I was waiting bullish trend for Bitcoin price chart until the end of March or the beginning of April.
If Bitcoin price completes this bearish scenario, we may see bullish trend at the beginning of April.
We will see..
Posted Using INLEO


Please join me on Bitsocial on Hive link