Bitcoin Price Broke Down Great Support Line Coming From All Time High Levels
There was great support line on Bitcoin price chart. Bitcoin price tried to break up mini downtrend lines. Even it broke up 2 mini uptrend lines, It could not break up 3rd mini downtrend line. I shared a few analysis and pointed these downtrend lines.
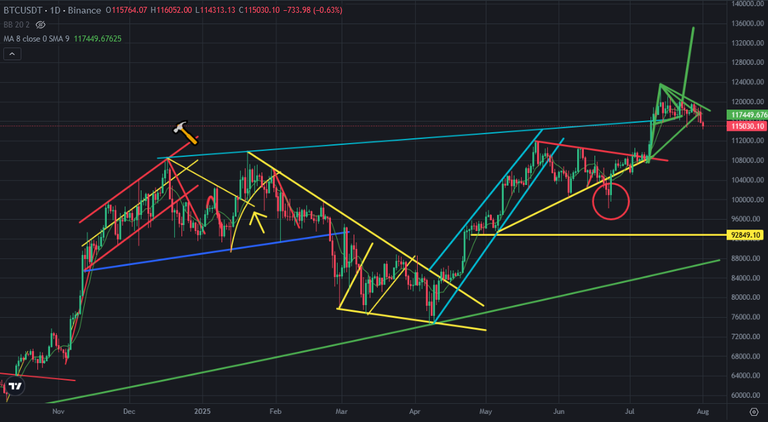
Here you can see daily chart of Bitcoin and my draft. There was grea support line on Bitcoin price chart. I was great resistance on Bitcoin price chart. After breaking up this great resistance, Bitcoin price supported by this resistance. It changed from resistance to support.
Today, Bitcoin price broke down this great support line.
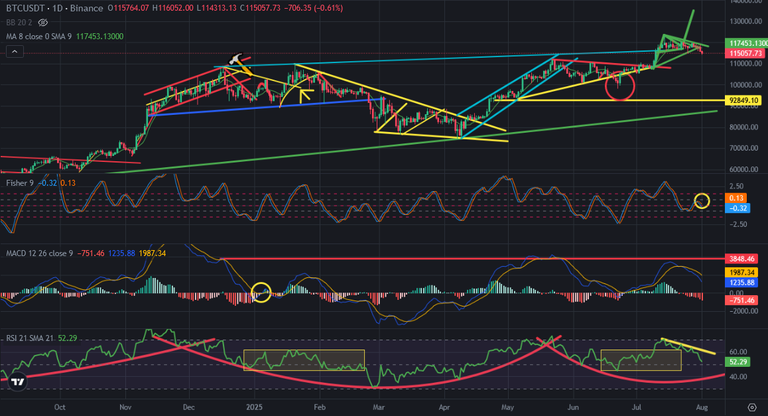
Here you can see the indicators on daily chart of Bitcoin price. Fisher Indicator reversed down from the middle. It may go down until the bottom. RSI Indicator is under resistance by downtrend line. MACD Indicator is still in correction. These are major reasons that Bitcoin price could not break mini downtrend line. Because Bitcoin price did need price correction. It started.
During price correction on Bitcoin price chart, Bitcoin price may not go up so much. Market maker may want to fill the time to complete price correction. We may see Bitcoin price going down slowly not fast as before.
We will see..
Posted Using INLEO
The price of bitcoin go down today a lot, checking the market today I see that it has had some altcoins to do the same as well. Maybe in few days time, the support line will push bitcoin up.