Bitcoin is Trying to Make Weekly Close Above the Middle Line of Bollinger Bands
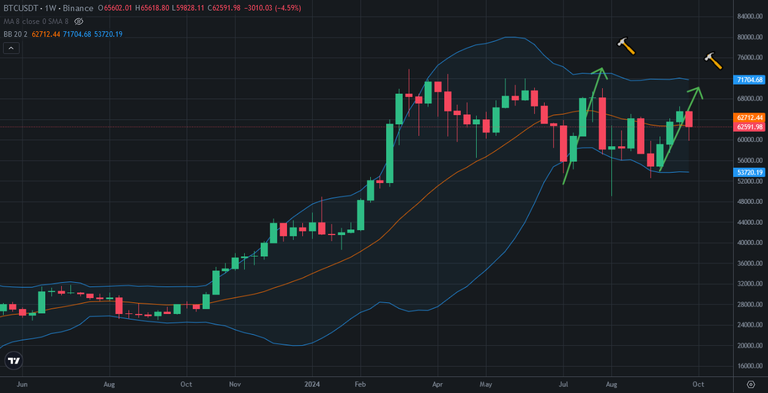
Today is the last day of this week and Bitcoin is trying to make weekly close above the middle line of Bollinger Bands. It is important for midterm trend. We have seen 3 weekly greencandles in this year. This is 2nd time. After 3 weekly green candles Bitcoin price went down to lower than green candles. Will it happen again?
Here you can see weekly chart of Bitcoin price. I drew the similarities. If Bitcoin price close below the middle line of Bollinger Bands, It is possible to see again. Bitcoin price may enter midterm bearish trend.
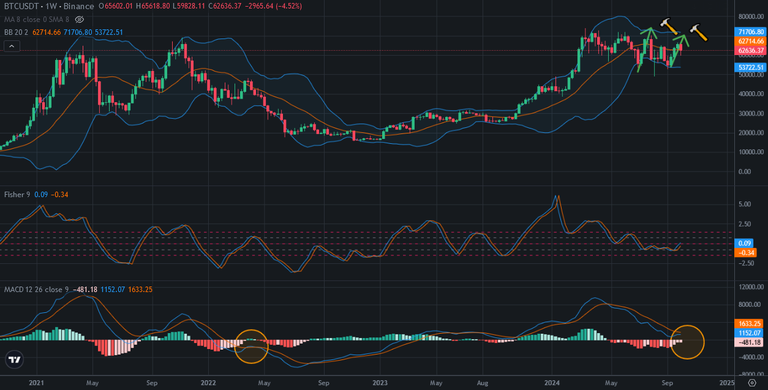
Here you can see the indicators of weekly chart of Bitcoin. MACD Indicator is trying to reverse. As I said, if Bitcoin price close below the middle line of Bollinger Bands, We may see more red weekly candles on Bitcoin price. These red weekly candles will resist for reversing on MACD Indicator. We have seen it before. You can see what happaned before after fake reversing...
If it happens, it will be great correction pf Bitcoin price pump. It will great chance to pick up crypto.
I shared lots of analysis about Bitcoin price dump. It happened after 67K. We are only at the beginning. It may take long time.
We will see..
Posted Using InLeo Alpha
Congratulations @chorock! You have completed the following achievement on the Hive blockchain And have been rewarded with New badge(s)
You can view your badges on your board and compare yourself to others in the Ranking
If you no longer want to receive notifications, reply to this comment with the word
STOPCheck out our last posts: