Bitcoin is Trying to Break up Mini Downtrend Line
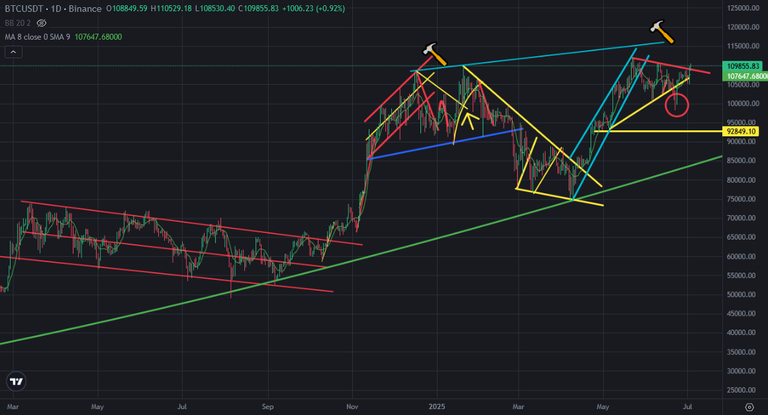
Bitcoin price is close to break up mini uptrend line coming from all time high. It is important price move for Bitcoin price chart because after breaking up mini uptrend line Bitcoin price will go to new all time high.
Here you can see daily chart of Bitcoin price. There was bearish trap on Bitcoin price chart when it broke down mini uptrend line. We should see confirmation of breaking up of mini uptrend line. Becasue market maker always makes fake moves. We may see new ones. While Bitcoin price is running to new all time high, we may see another trap of bullish..
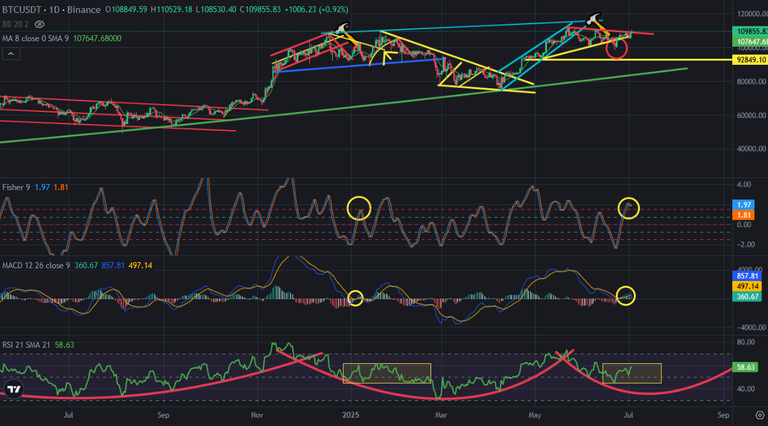
Here you can see the indicators on daily chart of Bitcoin. This is why I am waiting for a trap. Because we are still in same pattern as before. RSI Indicators is in bowl pattern as before. We may see same move on RSI Indicator. It is still in consolidation zone. We may see depression move at the end of this month.
Fisher Indicator is on the top. It is close to reverse down. MACD Indicator is moving as same as before. So, I think we may see bullish trap. If not, we should see confirmation of breaking up on mini uptrend line..
There are lots of similarities on Bitcoin price chart between past and now. We are waiting same move as before.
We will see..
Posted Using INLEO
Interesting analysis Bitcoin’s move here could either confirm a real breakout or just be another classic bull trap, so caution is key.