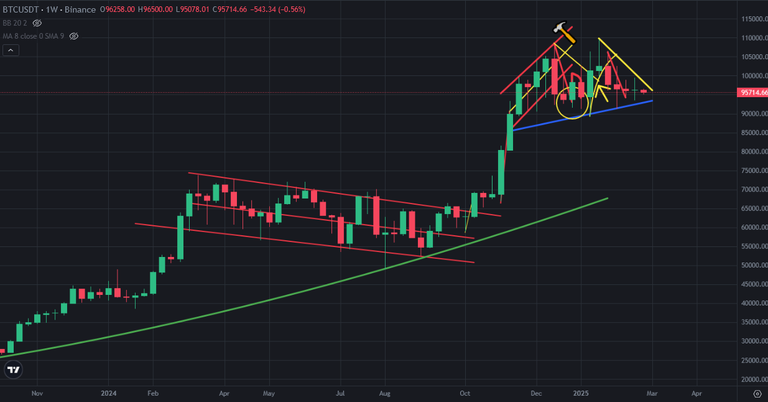
Bitcoin Got Green Weekly Candle to Break the red Candle Set
There were 3 red weekly successive candles on Bitcoin price chart. Bitcoin price closed last week with green candle to break the red candle set. We have now seen 5 red weekly candle series since Luna Crash May 2022. So, market maker may continue to show us more weekly red candles.
Here you can see weekly chart of Bitcoin for a year. There is no 5 successive weekly red candle on this chart. If Bitcoin price chart had got red weekly candle in last week, we would see 5 successive red weekly candle in this week. This is why market maker tried to close the week with green candle.
Here you can see the indicators on weekly chart of Bitcoin. I am waiting for a market crash for midterm. There is negative divergence on RSI Indicator on weekly chart of Bitcoin. We may see huge price drop on market to make this negative divergence..
MACD Indicator is also at bearish position. We should watch the complete the correction on MACD Indicator. It may take a few weeks to complete this correction. It is hard to see bullish trend on Bitcoin price chart without complete correction and negative divergence..
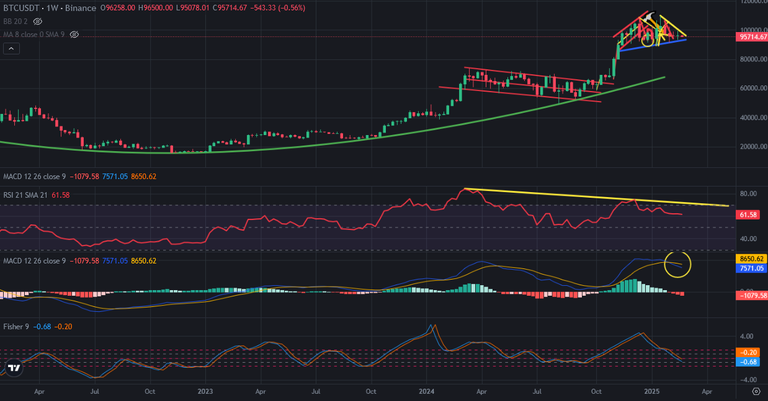
So, we should wait to see reaction of negative divergence on RSI Indicator and complete of MACD Indicator correction.
After Indicator complete patterns, we may see bullish trend on Bitcoin price chart.
We will see...
Posted Using INLEO
This post has been manually curated by @bhattg from Indiaunited community. Join us on our Discord Server.
Do you know that you can earn a passive income by delegating your Leo power to @india-leo account? We share 100 % of the curation rewards with the delegators.
100% of the rewards from this comment goes to the curator for their manual curation efforts. Please encourage the curator @bhattg by upvoting this comment and support the community by voting the posts made by @indiaunited.
So last buying opportunity ?
yess
When to buy ? I mean how low it is expected to go ?
I am picking up when market goes down. The time started to buy. Market will reverse up in 3 months...