Bitcoin Entered 5th Green Week After 2023
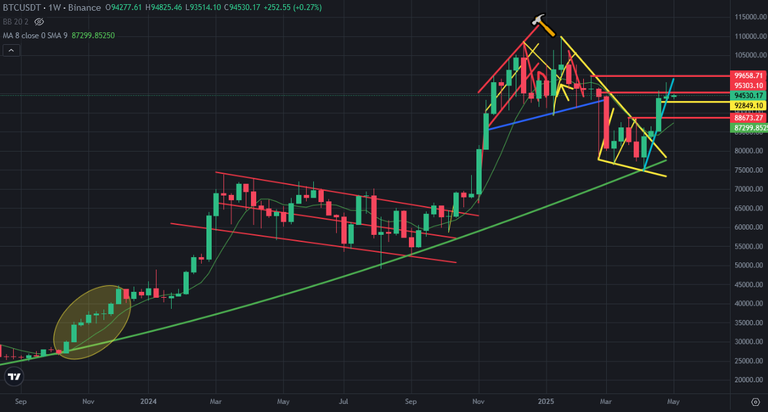
This is 5th week that we have seen 5 green weekly candle on Bitcoin price chart. We saw this weekly greeen candles series at the end of 2023. It was a bullish season. Now is it a bullish season?
Here you can see weekly chart of Bitcoin. We have only seen 4 weekly candles on Bitcoin price chart during 2 years. So, it may see possible to turn red in weekly chart.
Bitcoin close weak green candle the last week. I shared a few analysis about Bitcoin price chart and said I was waiting price correction on Bitcoin price chart in this week.
Here you can see the indicators on weekly chart of Bitcoin. MACD Indicator is trying to reverse up. Fisher Indicator reversed up from the bottom.
It may be early to bullish trend on Bitcoin price chart. If we see red weekly candle on Bitcoin price chart in this week, reversing up may take long time on Bitcoin price chart. I think It may be early to see reversing up on Bitcoin price chart.
We may see reversing down on Fisher Indicator and It may try to make lower high on this indicator. If it makes, we will see downtrend line on Fisher Indicator.
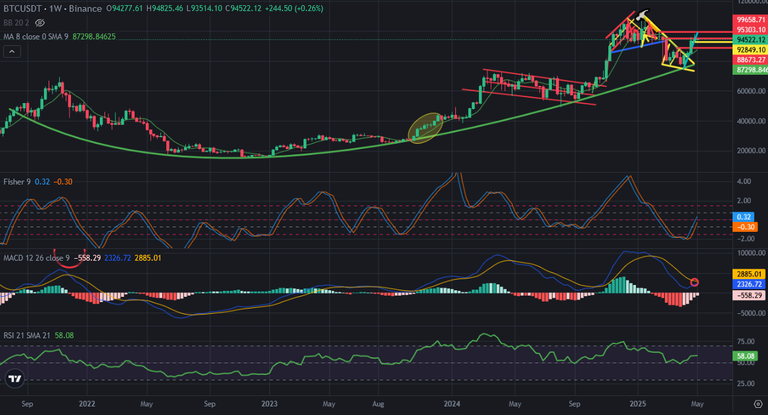
We should be careful on 5th week of Bitcoin price chart. We may see volatilty in this week. We should ready on sell button.
We will see..
Posted Using INLEO
This post has been manually curated by @bhattg from Indiaunited community. Join us on our Discord Server.
Do you know that you can earn a passive income by delegating your Leo power to @india-leo account? We share 100 % of the curation rewards with the delegators.
100% of the rewards from this comment goes to the curator for their manual curation efforts. Please encourage the curator @bhattg by upvoting this comment and support the community by voting the posts made by @indiaunited.