Big Bowl Pattern is on Bitcoin Price Chart
There is big bowl pattern on Bitcoin price chart. I shared a few analysis about Bitcoin price chart and I pointed the big bowl pattern on Bitcoin price chart. I updated my draft and Big Bowl pattern is not as symmetrical. So, We may see breaking down on this pattern after half of May.
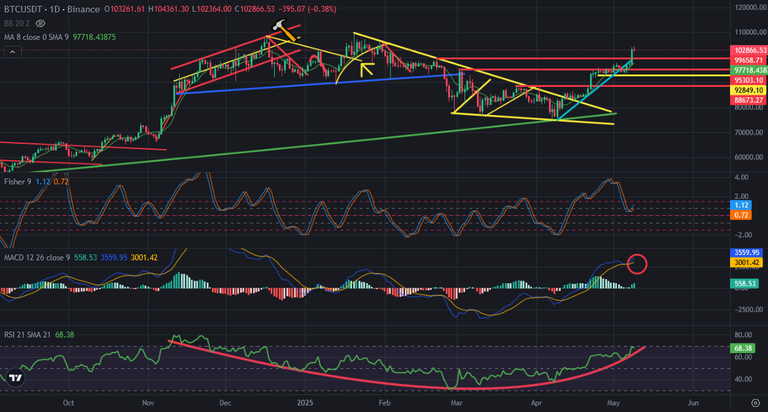
Here you can see daily chart of Bitcoin. There is big bowl pattern will be broken down in a few days. We may see uptrend in next week but we will see price correction after next week. MACD Indicator reversed up again. Fisher Indicator is at good level to go up. But Support line of RSI Indicator is following. It will be broken down in a few days.
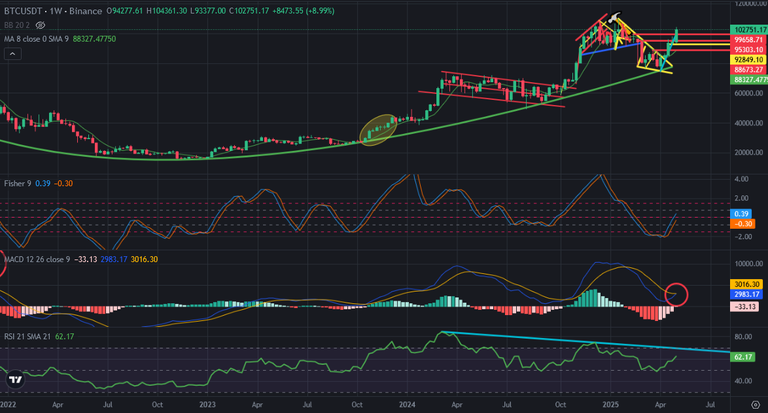
Here you can see weekly chart of Bitcoin. MACD Indicator is close to reverse up. Fisher Indicator is going up. There is downtrend line on RSI Indicator. It may resist if it touches. I think Fisher Indicator will make lower high. If we see red weekly candle, we will see lower high on Fisher Indicator.
I am waiting bor freaking down on Big Bowl pattern in a few days. May will be with two side. We are at bullish side, we will enter bearish side after half of this month.
We will see..
Posted Using INLEO
This post has been manually curated by @bhattg from Indiaunited community. Join us on our Discord Server.
Do you know that you can earn a passive income by delegating your Leo power to @india-leo account? We share 100 % of the curation rewards with the delegators.
100% of the rewards from this comment goes to the curator for their manual curation efforts. Please encourage the curator @bhattg by upvoting this comment and support the community by voting the posts made by @indiaunited.
This is unique and timely.
That's an interesting analysis! I agree that the next week could see some upward movement based on the daily MACD and Fisher. And definitely something to be cautious about as we moved through May.
Appreciate you sharing your technical analysis.